FAQ
This section should help address the most common issues or questions encountered.
How can I improve the accuracy of my catchment?
There are a few things that can be done to improve catchment accuracy.
Use a custom accurate population raster
Use a custom higher resolution DEM
Integrate as much data as possible on the map, such as sewage lines. See Sewage line improvement. Add OSM data and exclude areas that you know are not contributing to the sewage network by using barriers and / or exclusion zones (see Barriers and Exclusion zones).
How can I tweak the processing parameters of my map?
See section Change the map processing parameters. See also processing section to understand better how the map is being calculated.
My DEM upload failed
My population raster upload failed
My site upload failed
My sewage line upload failed
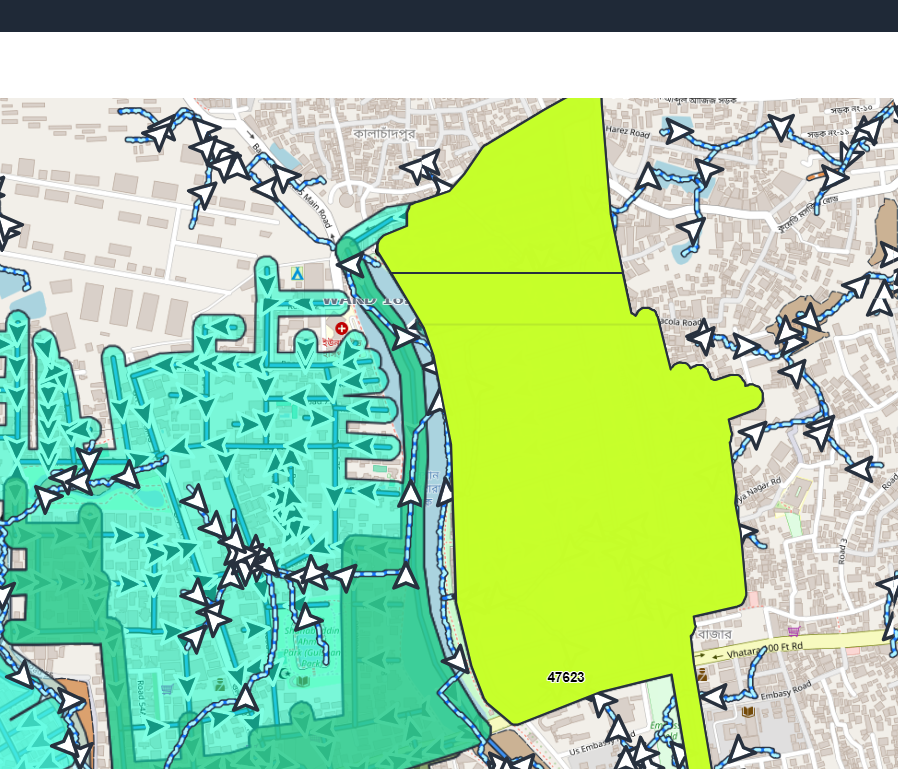
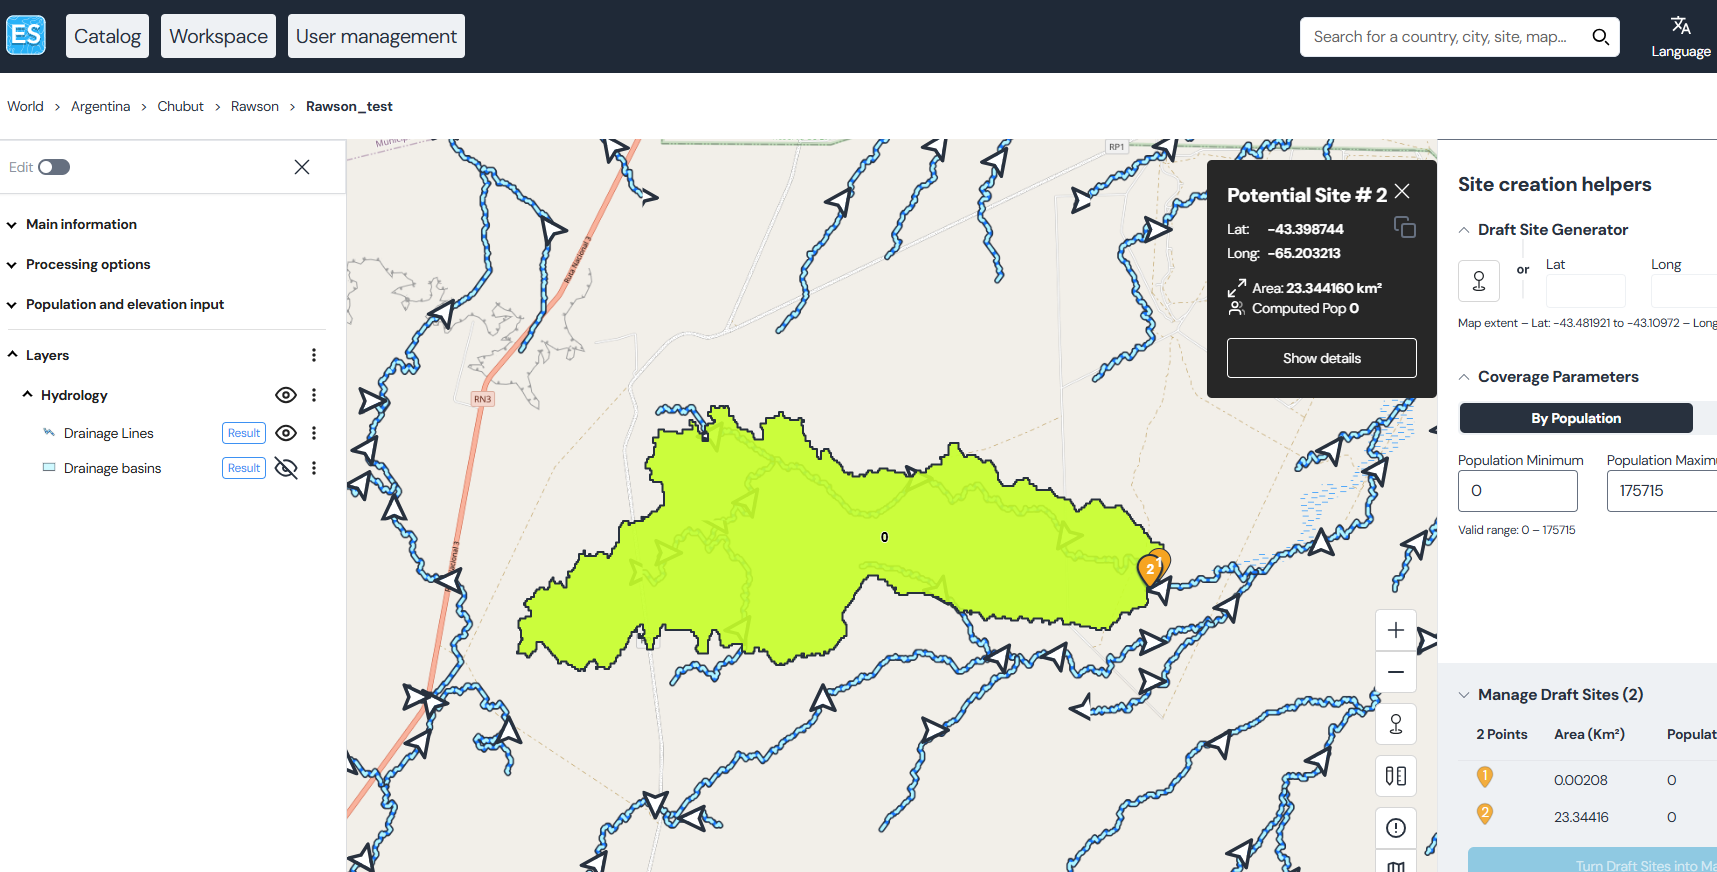
Why are the watersheds jagged?
The watersheds are derived from a DEM raster (see for instance our methodology). The DEM rasters can have different resolutions, and typically, the watersheds will have the same resolution as the DEM. Exceptions are watersheds that are based on closed sewage lines.
Why do the watersheds contain strange lines?
This kind of visualization is because we are using vector tiles to render the map. This is only a visualization artefact.
I have my sites as a CSV - can I upload the CSV directly?
This is unfortunately not possible for the moment. However, it is easy to convert a CSV to a GeoJSON (or Shapefile even) which can be imported. To do so, go to https://mygeodata.cloud/converter/xls-to-geojson.
I would like to have my site metadata imported!
The application supports a wide set of metadata. In order for the metadata to show on the catalog, the columns need to match the site data schema. If you have the sites in an excel file, simply update the column titles to match the site data schema and convert that excel file into a format that is supported (see Sites in a CSV).
I already have a database where all of my site and sample data is stored. Can I integrate this database in this application?
Yes, you can. This application can integrate with existing systems. Please refer to the xMart document.
How do I improve my sewage line accuracy?
An accurate sewage network warrants the most precise catchment areas. There are several options to improve the precision of the sewage network. Get in contact with the water and sewage authority where you want to set up your site.
Digitize the major sewage lines manually and upload this layer (see Editing sewage lines). There is no limitation to how much and how precise you would want to collect this data. The more data you have, the more accurate the catchment will be.
Collect the major sewage lines of an area in the field using ODK (see ODK). You can collect a good amount this way, but at one point the GPS precision (about 10m) may become an issue when collecting entire sewage networks. This is easy to do and you only need a phone to do it, the rest is taken care of by the application.
Use open or closed sewage lines depending on the requirements. For closed sewage lines, you can indicate the flow direction. Open sewage lines will always follow the slope of the DEM.
How are sites assigned their location in the geographical navigation of the catalog?
While a site has its own geographical attribution, it is not the one being used to sort it under the geographical navigation of the catalog. The location that is used to sort a site geographically is actually that of the map that it belongs to.
Take this map for instance:
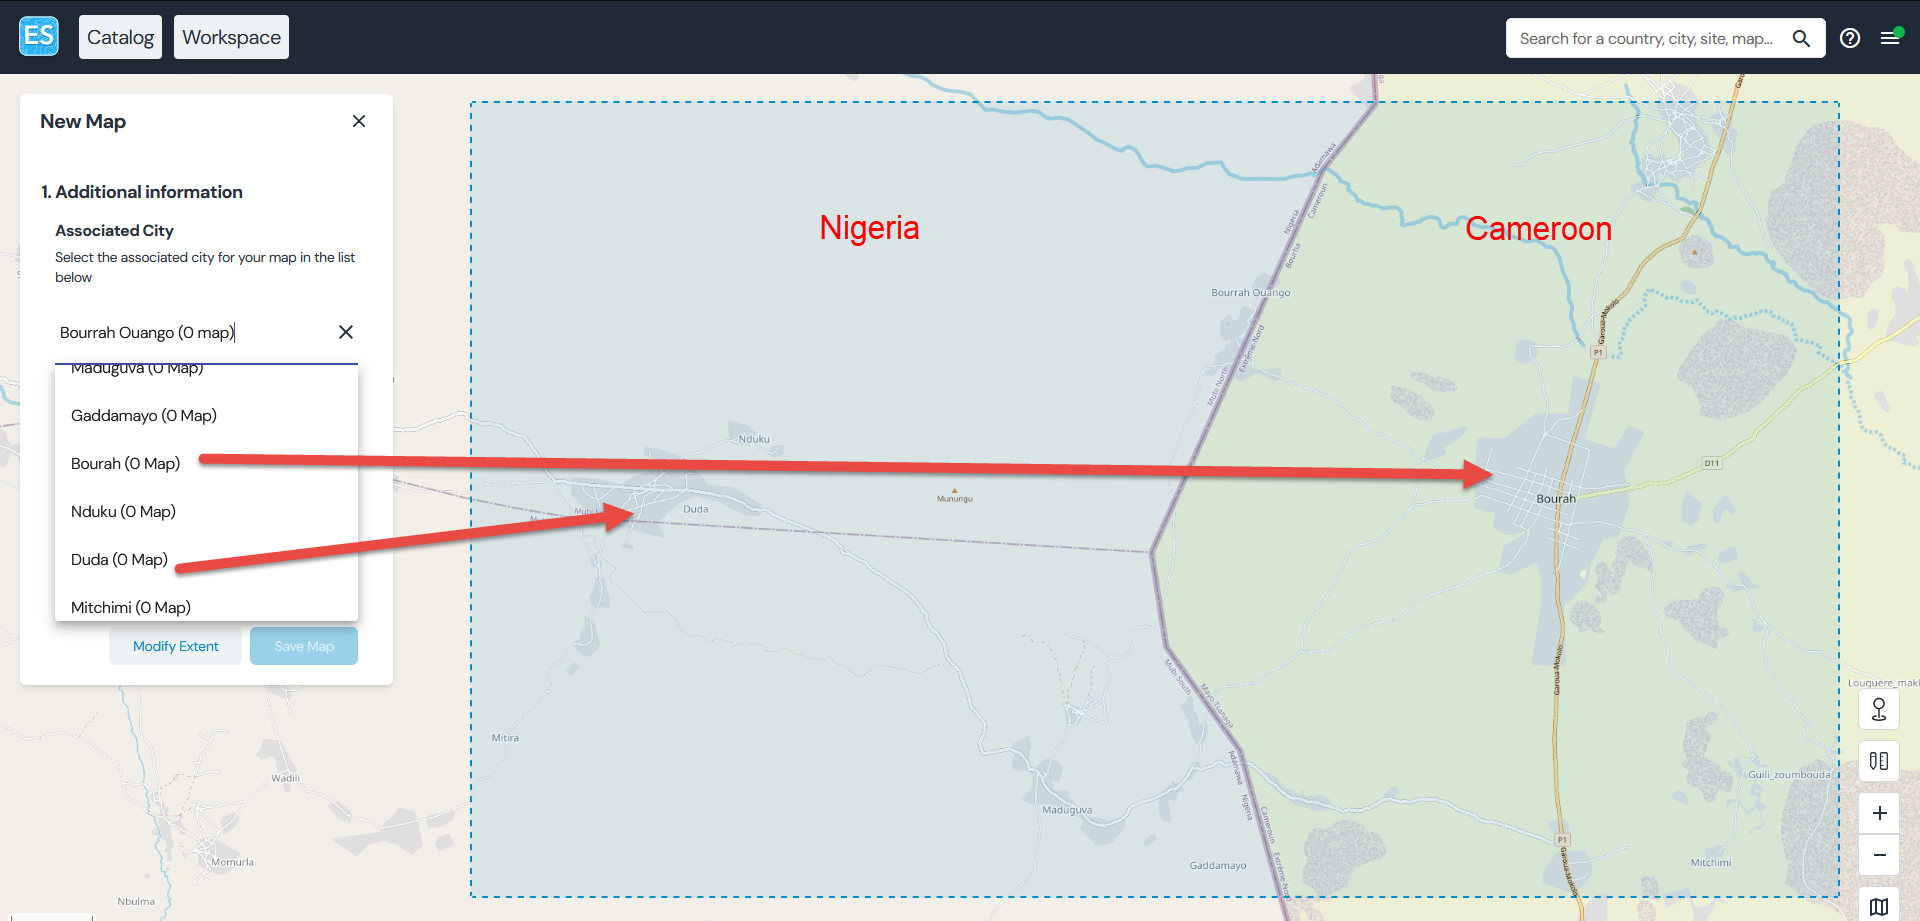
If the author of this map chooses Duda as its location, the map will be sorted under “Nigeria → Adamawa → Duda”. If the author chooses Bourah, it will be sorted under “Cameroon → Extreme Nord → Bourah”.
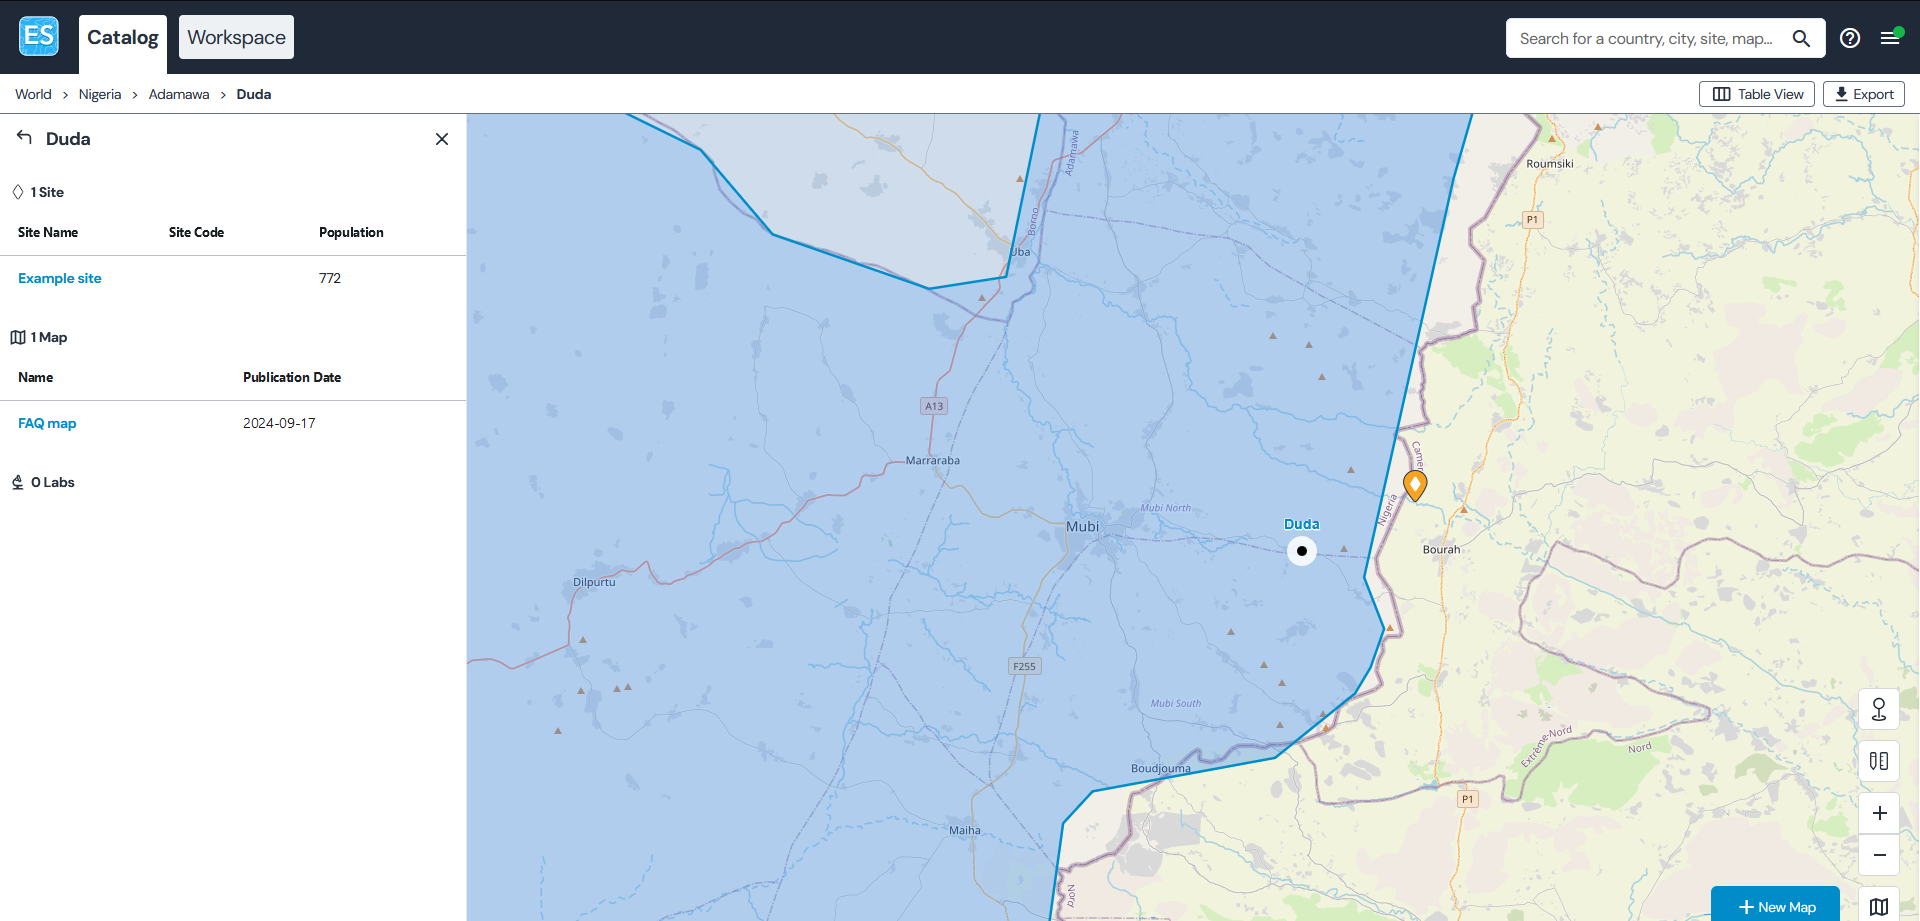
Let’s assume that the map author chose to locate this map in Duda (Nigeria). Now the author adds a site as such:
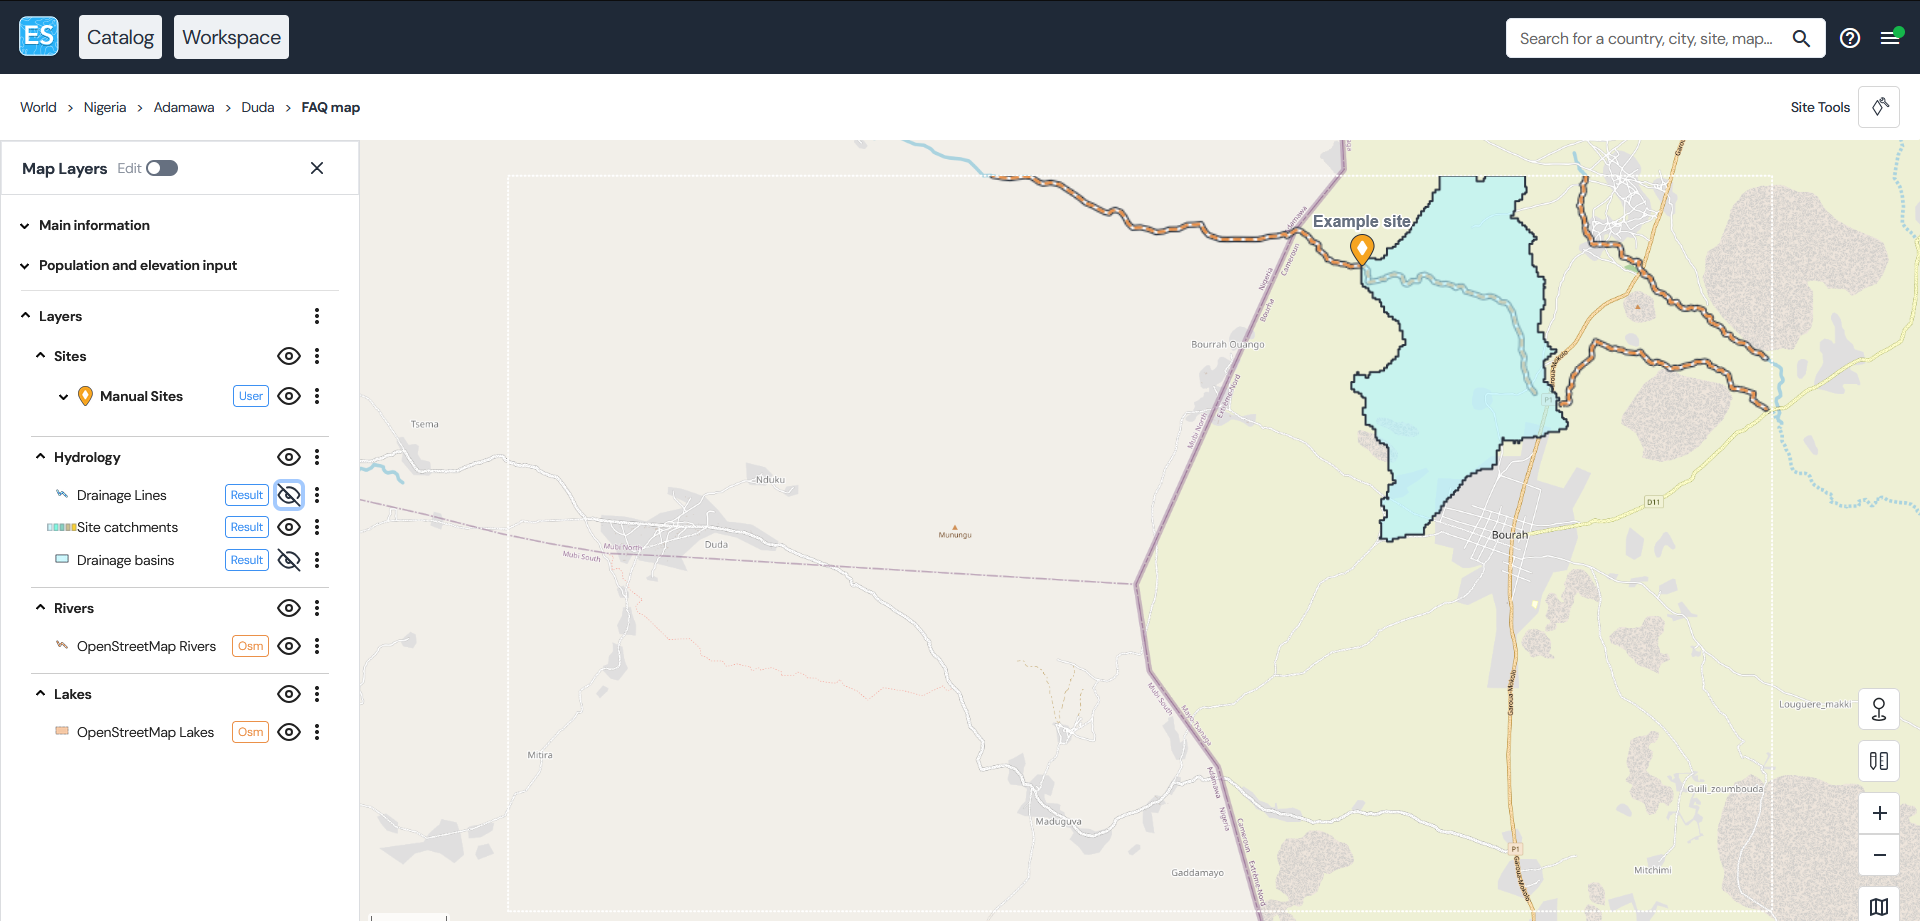
This site, in itself, is located in Cameroon. However, since it belongs to a map of Duda (Nigeria), it will be found in the catalog under “Nigeria → Adamawa → Duda”, along with its parent map:
What is an outdated processing engine?
As part of the ongoing development of the ES platform, the engine that is responsible for the hydrological processing of maps is updated from time to time.
As a result, you can have a map that was processed in April 2024 with the processing engine v1.0.0, while the processing engine in December 2024 is v1.5.0. The dynamic tools always use the latest processing version. Thus, if running the dynamic tools in December 2024 on a map that was created in April 2024 and not updated since, the calculation of drainage lines and basins could be different between the two. As a result, dynamic catchments of draft sites (produced with engine v1.5.0) may not be coherent with drainage basins and drainage lines produced with v1.0.0.
An example is shown below:
This limitation will be addressed in the next release of ES (v4.4). In the meantime, you may work around this situation by re-processing your map from the Workspace.