ODK
Why ODK
To overcome some of the limitations mentioned in Limitations, and in order to improve the accuracy of the modelled catchments, the actual sewage situation in a city can be added to a map. This can be done in two ways:
Digitization of the sewage flow using an offline editor such as QGIS and uploading this via the editor (see Sewage lines)
Collection of major sewage lines on the ground using a mobile phone and ODK.
To support the latter, a set of Open Data Kit (ODK) forms has been configured. These forms can be used to:
Record an Environmental Site location
Digitize a waterway
You can make use of this system by following three steps:
Install Open Data Kit (ODK) collect on your phone
Within Open Data Kit (ODK) collect, click on ‘Add Project’
Scan a QR code from within ODK - to obtain the QR code, please contact us
Once done, you can digitize sewage channels in your location of interest using these forms or digitize site data using these forms.
Hint
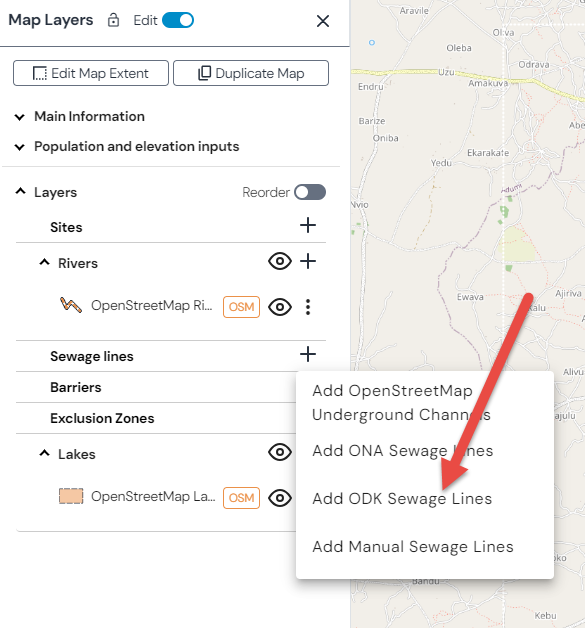
Adding this collected data to your map is very easy if you are using the provided WHO ODK server (check Sewage lines). However, if you have your own ODK server or another system to collect data, you could import this via xMart.
For instance for adding ODK collected sewage lines:
SOP for Blueline Collection
It is important to follow some standard practices when digitizing sewage channels (also referred to as ‘bluelines’). For an in-depth explanation of this process including some examples of good and poor practice, please see Blueline Collection SOP.
A short summary is shown here:
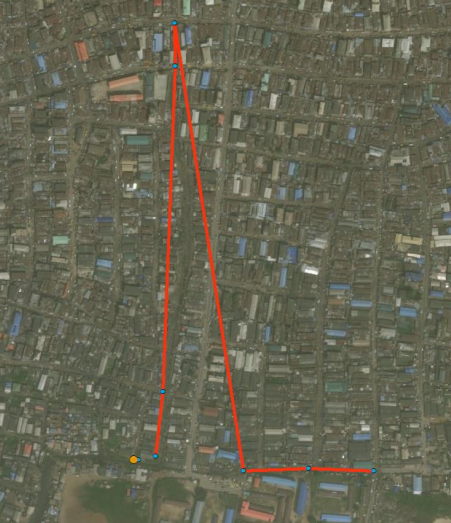
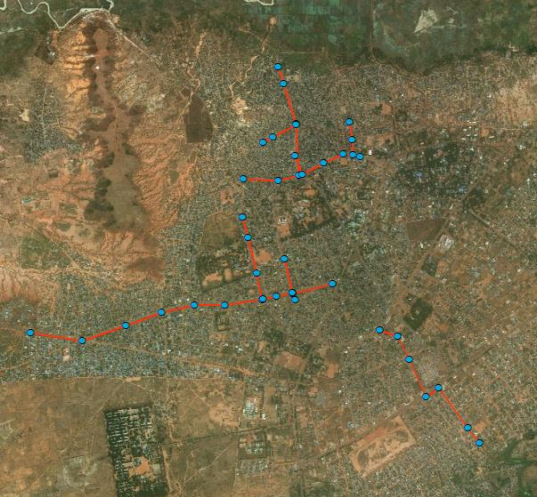
Start collection at the site or as much downstream as possible
Collect every 50m or so a point
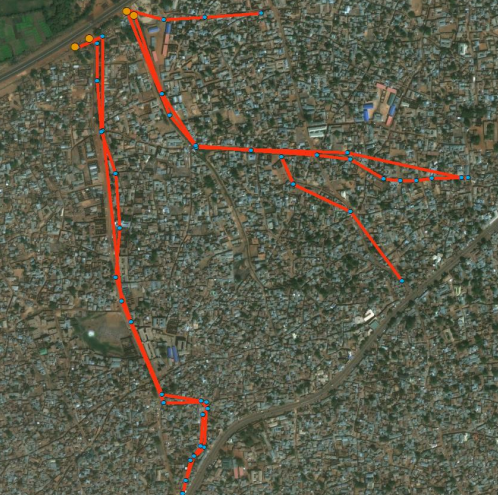
Collect each segment in a separate form (different colors in the screenshot below)
Start each segment at a point where it overlaps with another segment
Hint
Note, when digitizing closed sewage lines, the flow direction is of utmost importance. This needs to be taken into account when collecting data in the field. In such cases, it might be easier to use a paper map and digitize the data afterwards in a desktop application, because the ODK forms cannot be used to indicate directionality as of today.
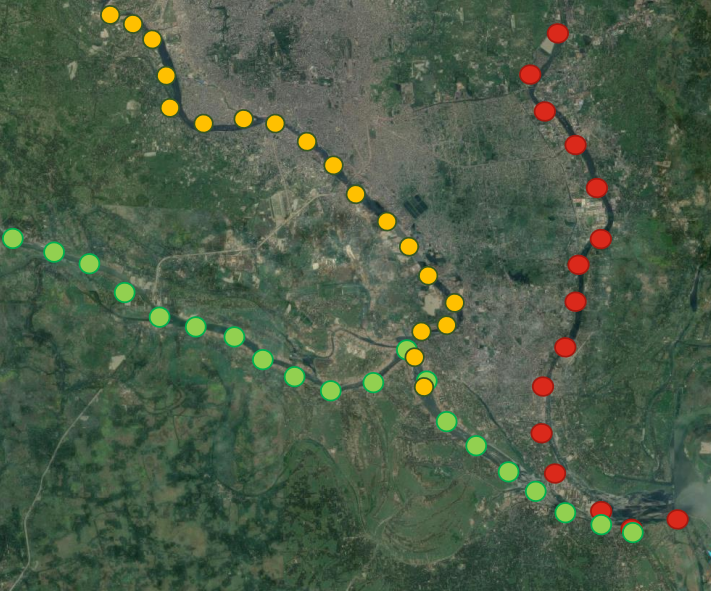
Poor collection examples
This is an example of a poor blueline collection - here, data was collected on the way back as well (so the tracks are duplicated):
This is another example of a poor blueline collection - here, one form was used to collect two segments and the collection was not started downstream from the junction point to collect the side arm.
Good collection example
This is an example of a good blueline collection:
Hint
If the collected data is not accurate, it can still be corrected via Remote source editing, but this can be cumbersome.