Elevation Data (DEM)
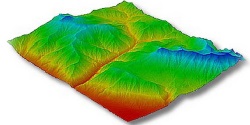
Digital Elevation Model example
A digital elevation model (DEM) is a digital model or 3D representation of a terrain’s surface created from terrain elevation data.
Get terrain elevation data
Terrain elevation data come in different forms, but are most commonly used as DEM. DEM are rasters where each cell holds one (and usually only one) value: the elevation at this location. Different kinds of DEM exist, notably DSM and DTM. DSM are easier to produce, but are often less accurate than DTM to model surface hydrological drainage.
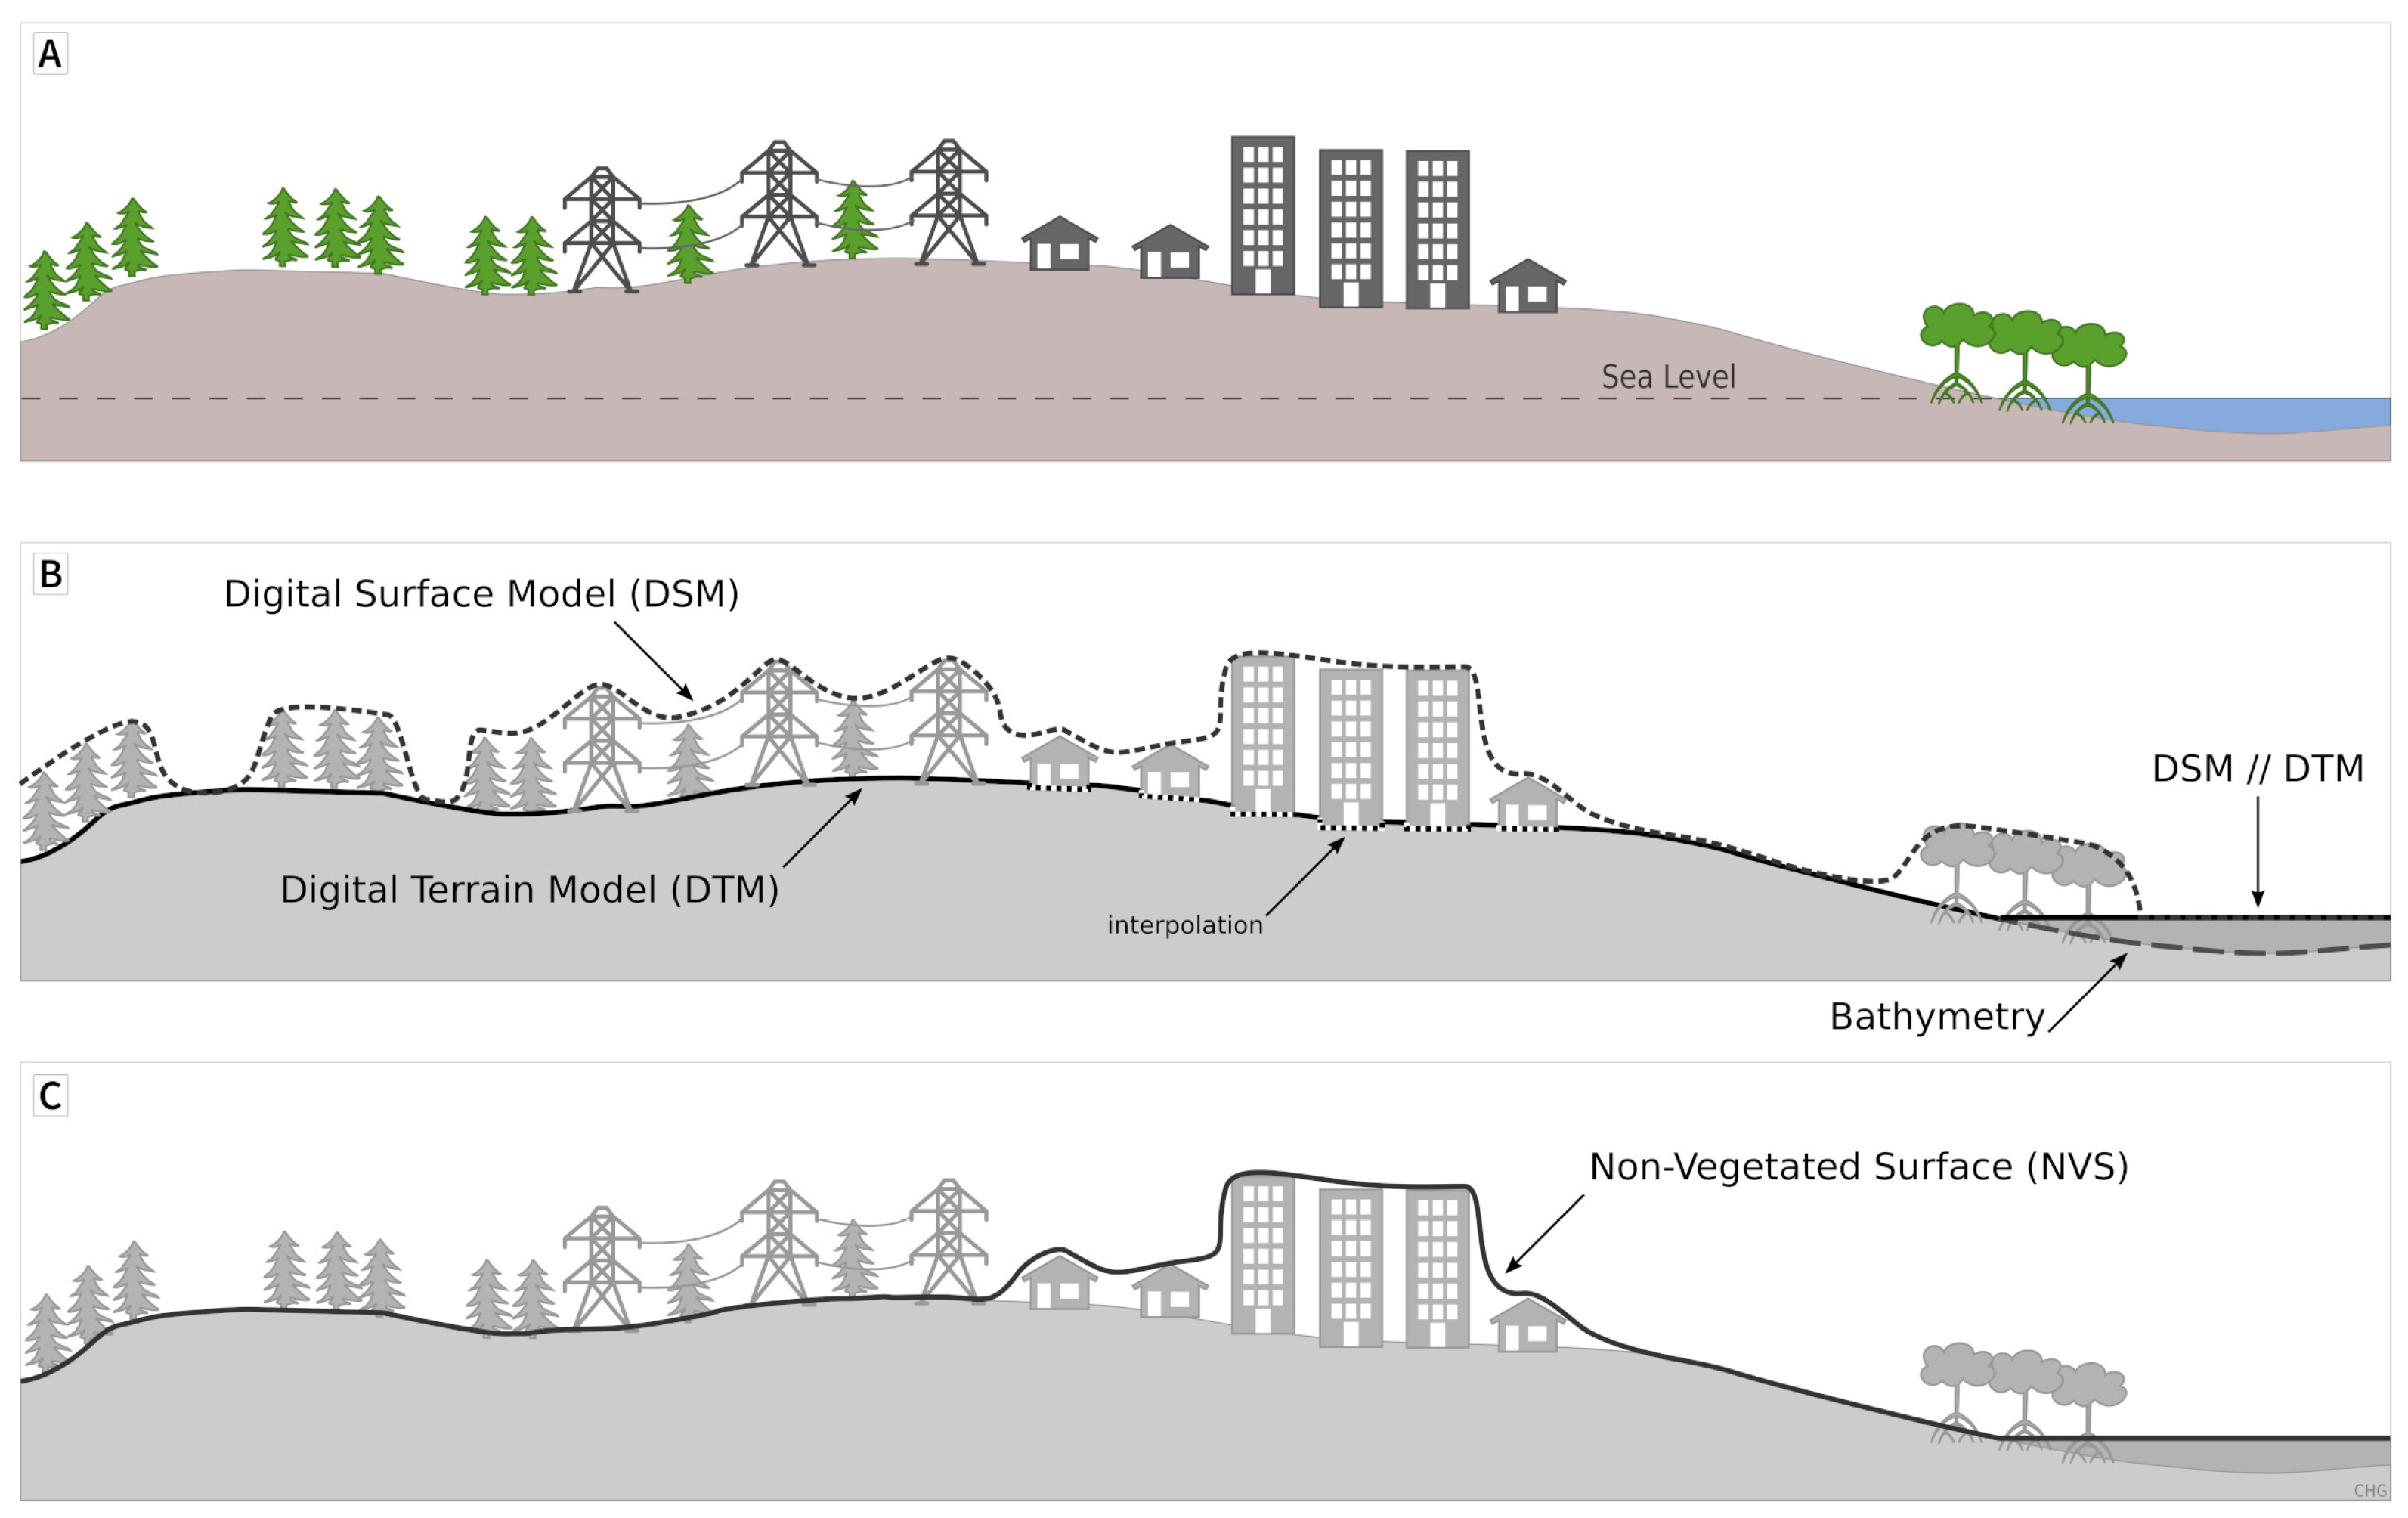
Difference between DSM, DTM and NVS. Source: Guth PL, Van Niekerk A, Grohmann CH, Muller J-P, Hawker L, Florinsky IV, Gesch D, Reuter HI, Herrera-Cruz V, Riazanoff S, et al. Digital Elevation Models: Terminology and Definitions. Remote Sensing. 2021; 13(18):3581. https://doi.org/10.3390/rs13183581
Note
Given enough GSD, and sometimes coupled with point classification data, DSM can actually be useful to model surface drainage with high resolution. However, this is often beyond the scope of WES that involves large catchments, usually capturing areas in the 100s m² to several km² range. This is why properly hydrologically-conditioned DTM are still the preferred way of modelling ground relief when it comes to surface drainage for WES.
Note
If you want to know more about DEM, you can read this article or the extensive Terrain book.
A word about DEM resolution
“Resolution” is a general term that, when it comes to DEM, captures two equally important and distinct characteristics:
Horizontal resolution (GSD).
Accuracy of the elevation measurement (vertical accuracy).
Horizontal resolution, or GSD, is the distance between the centroid of two neighbour cells. Since DEM usually use square cells, GSD is only one number. When we say, for instance, that public open DEM datasets have a GSD of 1 arc second, or 30 m projected, at the equator, it really means that the centroid of any given cell in the raster is 30 m away from the centroid of its neighbour cells. The lower the GSD, the higher the resolution and the more detailed picture you get.
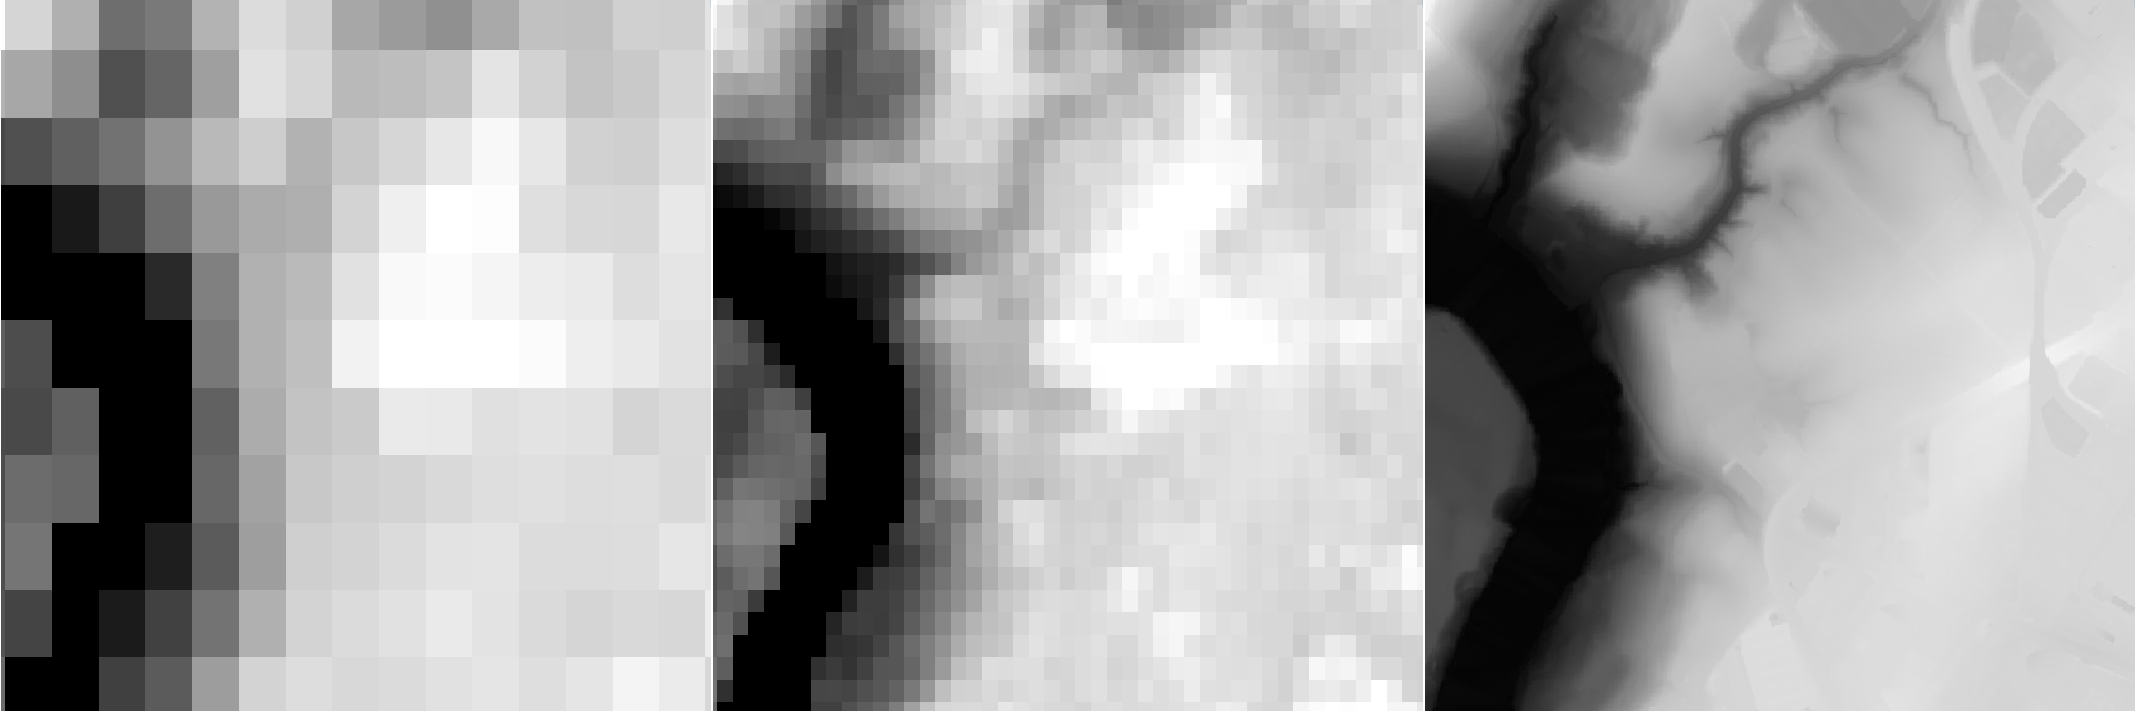
Comparison of DEM GSD: 90 m (left), 30 m (center), 2 m (right).
While good GSD definitely helps modelling surface flow, vertical accuracy is just as important. Vertical accuracy measures the precision of the altitude value that is reported by each cell in a DEM, and is commonly expressed as a confidence interval (CI95 for instance), a percentile linear error (LE90 for instance) or a single value. In any case, this value should be as small as possible. A 5 m vertical accuracy tells you that, if the DEM says that cell x, y has an altitude of 200 m, its real altitude could be anywhere between 197.5 m and 202.5 m.
Public and open global sources
Over time, several space missions allowed the production of global (worldwide) DEM. These DEM were derived from data acquired by satellites operated by a number of space agencies, using radar or optical sensors. The horizontal resolution (GSD) of these DEM is currently of 1 arc second (~30 m at the equator).
Public sources of worldwide DSM are:
ASTER global DEM (article), from the Japanese ministry of economy, trade, and industry, and NASA.
ALOS World3D (article), from JAXA.
NASADEM (article), from NASA, is an improved and merged version of SRTM and ASTER global DEM.
Copernicus GLO-30 (article), from EUSPA.
Several DTM were derived from these DSM and released publicly:
FABDEM (article) derives a pseudo-DTM from Copernicus GLO-30 by “removing” buildings and forests from it.
FathomDEM (article) also derives a pseudo-DTM from Copernicus GLO-30 by trying to remove all surface artefacts with an AI model.
GEDTM30 (article) derives a pseudo-DTM from several DSM and imagery sources using AI models.
“Local” sources
The public and open global sources provide a great starting point, but their resolution may be a limiting factor in some AOI, notably in densely built-up area for instance. A way to overcome this is to use local sources of DEM in addition (or as a replacement) to global ones. Several options are usually available:
You can look up if there are national/local data made available by public authorities. For instance, the Swiss government released a nation-wide DSM with 0.5 m GSD, swissALTI3D.
You can order higher-resolution commercial DEM of your AOI from several sources (UP42 for instance), and you might get data with horizontal resolution as high as 0.5 m. These data are also acquired by satellites. Note that although the datasets acquired by these companies are usually (though not always) global, you only order the data for your AOI.
You might acquire data yourself, for instance by flying a UAV over your AOI. As discussed in this section, UAV are not only able to acquire optical imagery in the visible spectrum, but also to reconstruct a very-high resolution DSM (usually in the order of 0.2 m GSD) and, after point cloud classification, derive a DTM with similar resolution from it.