Terrain Ruggedness Index
Preamble
This page helps you understand whether the terrain in your area of interest could make environmental surveillance (ES) easier or harder to plan. It does this using a Terrain Ruggedness Index (TRI), a simple measure of how hilly or flat the landscape is, calculated from elevation data. The more rugged the terrain, the easier it often is to predict how water (and what it carries) flows through an area, which matters when mapping where to place ES sampling sites.
How the TRI works
TRI quantifies topographic heterogeneity from a DEM. It computes local differences in terrain elevation at each pixel of a DEM by observing surrounding pixel values, and creates a new raster from these. Two main algorithms have been developed to compute TRI: the Riley algorithm [Riley1999], better suited to terrestrial terrain, and the Wilson algorithm [Wilson2007], better suited to bathymetric (underwater) data. We used the Riley algorithm on the FABDEM V1-2 30 m resolution pseudo-DTM [FABDEM] [FABDEM.V1-2] to produce the results shared in this page.
TRI can be useful for program leaders to help them quickly identify where environmental surveillance programs focusing on gravitational flow might be easier to map. The rationale: in a hilly city, it is easier to model correct flow direction for both underground sewer pipes and for surface channels. When flow directions are modelled correctly, this often means more accurate modelling of the site catchments themselves, ultimately resulting in better overall maps.
TRI of large cities in the Global South
Note
The definition of the Global South given by UNCTAD in their [TD-STAT.47] report was used as a reference. This report itself bases its definition on [Hoffmeister2020]. City population data was obtained from the [POP-DB-WUP-Rev.2025-F21] dataset.
Boundaries of all cities in the Global South having more than 100’000 inhabitants in 2026 were used to compute the mean TRI value of these cities. This is the distribution of TRI across the 5’297 considered cities:
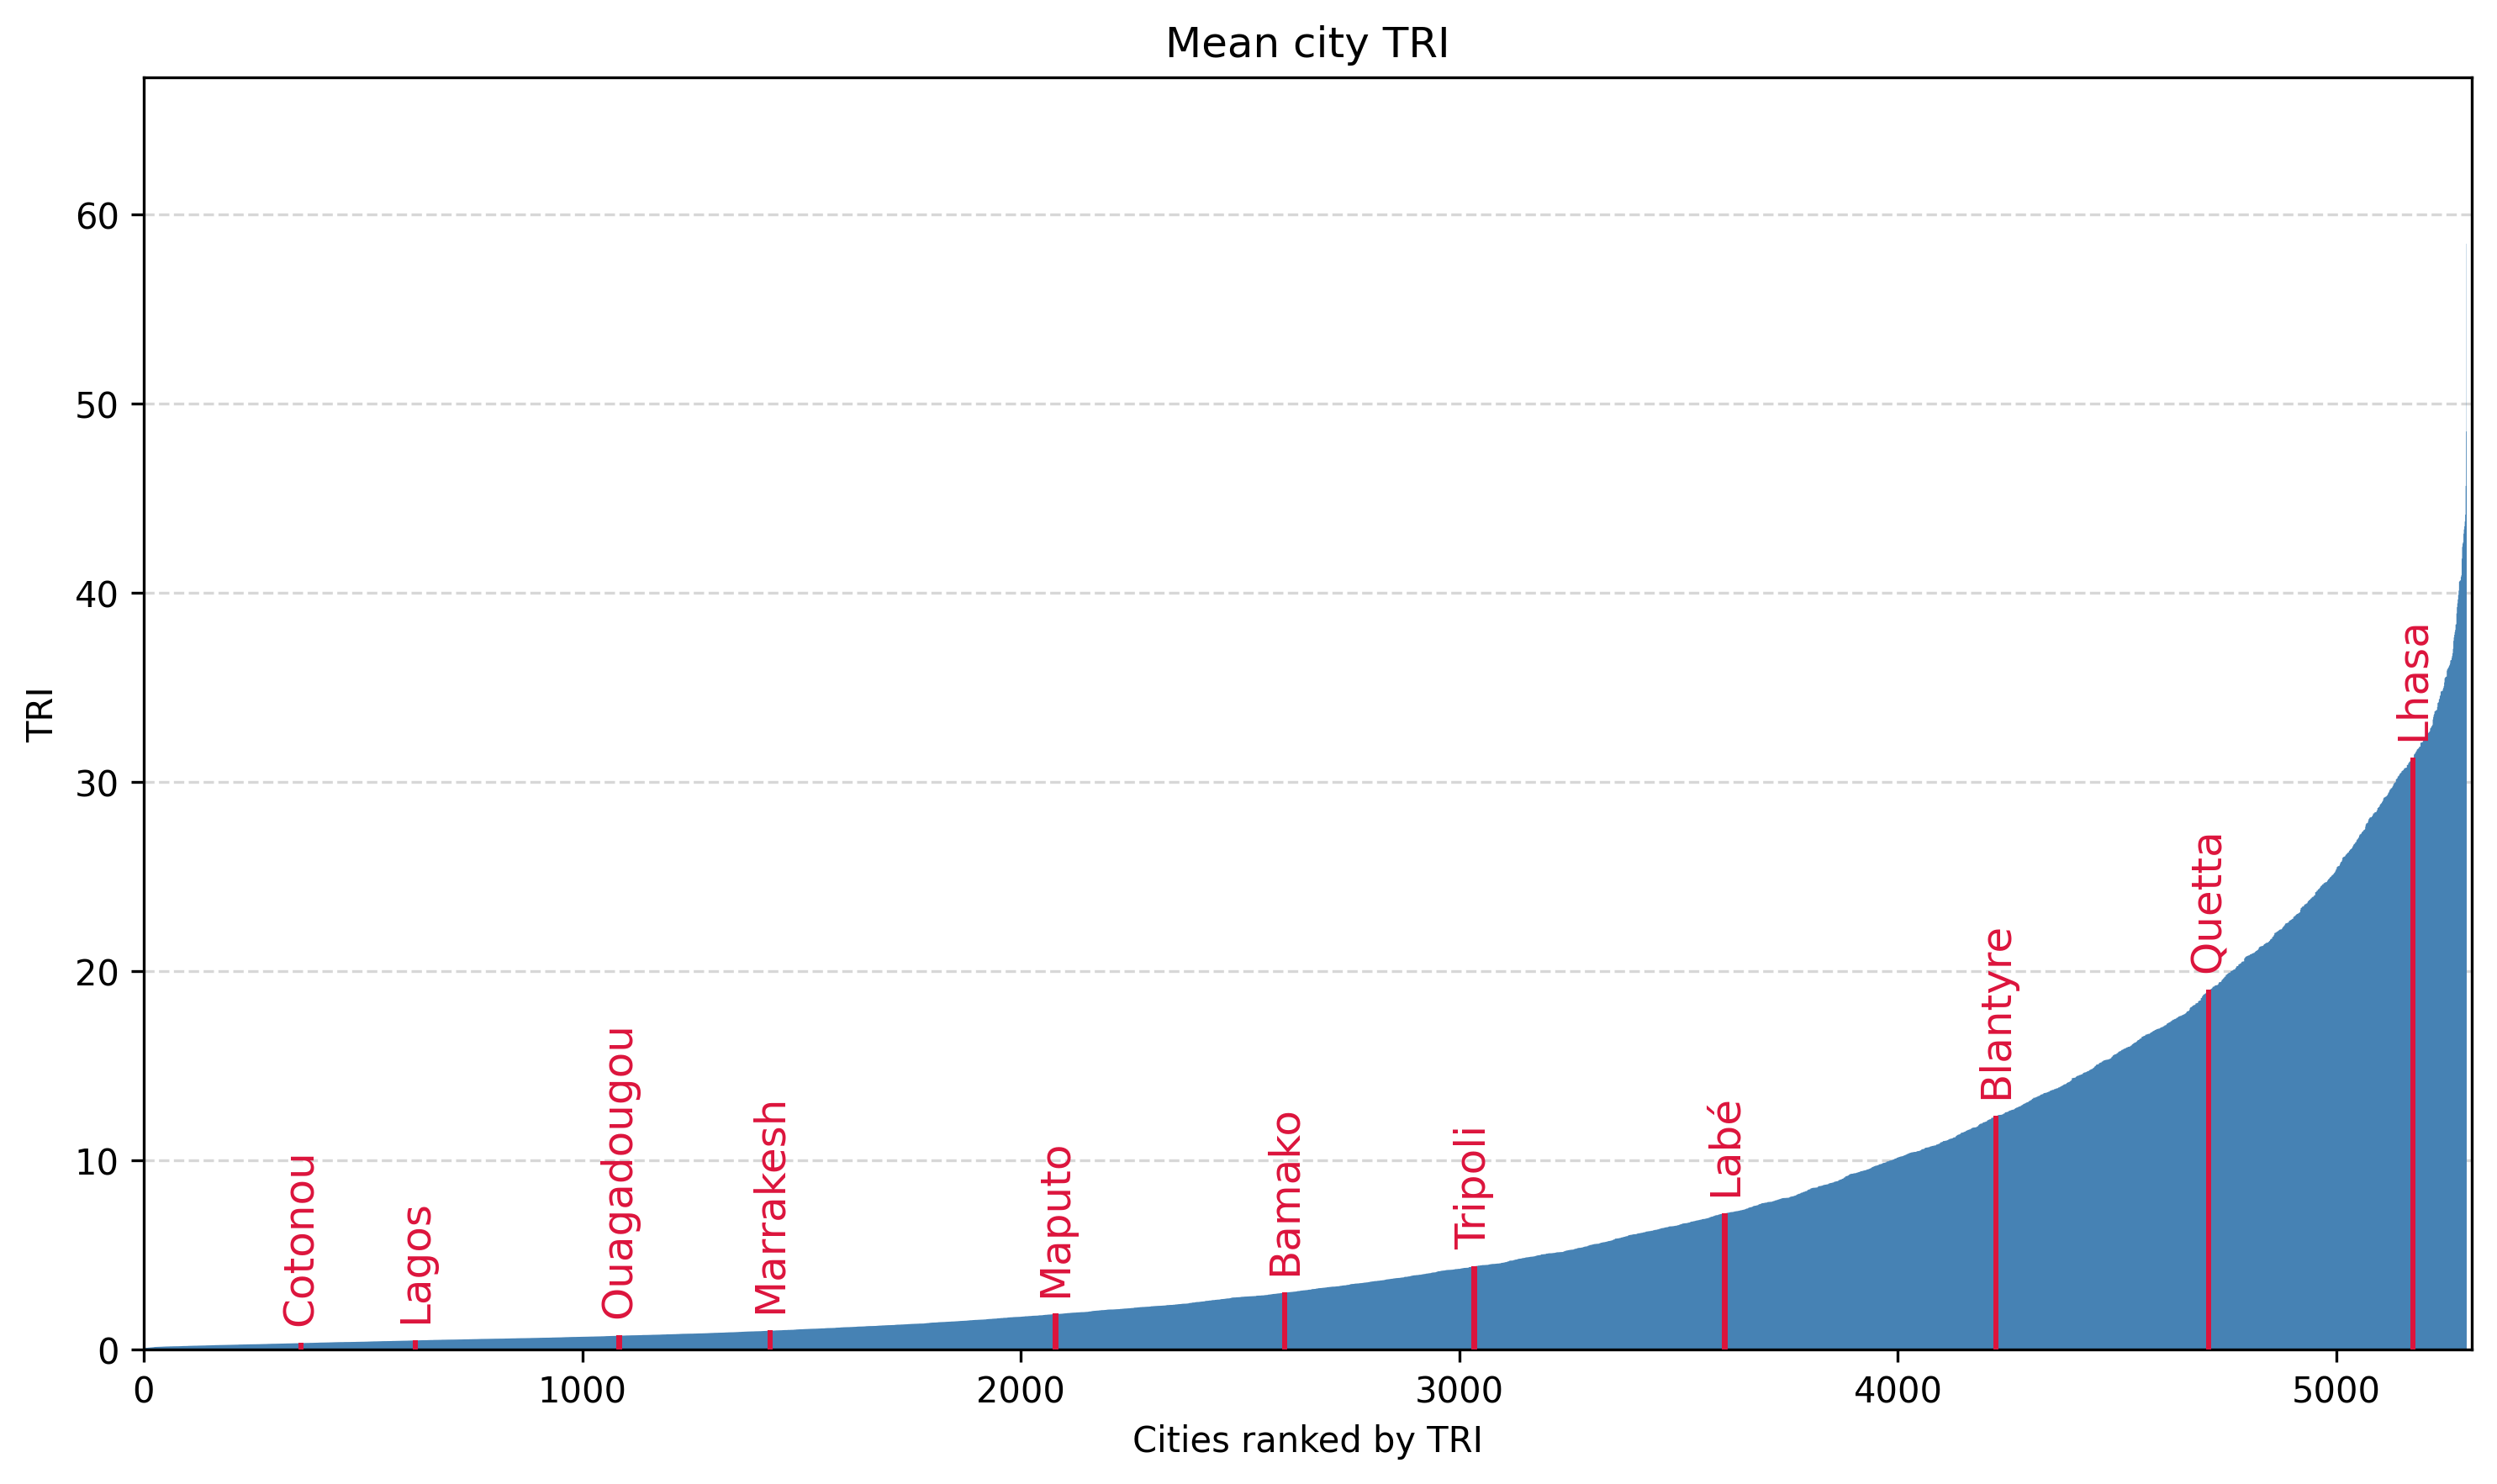
Distribution of TRI across 5’297 Global South cities having > 100’000 inhabitants in 2026.
Note
How to use this data: each point on the curve is one city’s mean TRI, with cities ranked from flattest (left) to most rugged (right); the labelled cities are reference points to help you place your own city on the scale — those further to the right sit on more rugged terrain, where modelling gravitational flow using a DEM for environmental surveillance tends to be easier. For Geneva — with a TRI of 3.5 — a high-resolution DEM (20 cm) is in many cases already very useful to model flow correctly, while cities such as Maputo or Dhaka — with TRI values of 1.9 and 0.7 respectively — pose a bigger challenge.
You can download the entire dataset as CSV or
GeoPackage to look up your city of interest.
Warning
City boundaries were retrieved automatically from OpenStreetMap when available, and 10 km buffers around city centers were used when boundaries could not be found. In some instances, the boundaries obtained from OpenStreetMap are that of the encompassing district or region, which may affect the TRI of the city wildly. City boundaries will be manually curated in an next release. Boundaries used to compute the mean TRI of all cities can be inspected in the GeoPackage dataset directly.
References
Riley, S.J. et al. (1999): A Terrain Ruggedness that Quantifies Topographic Heterogeneity. Intermountain Journal of Science, Vol.5, No.1-4, pp.23-27. Link.
Wilson, M.F.J et al. (2007): Multiscale Terrain Analysis of Multibeam Bathymetry Data for Habitat Mapping on the Continental Slope. Marine Geodesy 30:3-35. DOI: 10.1080/01490410701295962.
Hawker L.P. et al. (2022): A 30 m global map of elevation with forests and buildings removed. Environmental Res. Lett. 17 024016. DOI: 10.1088/1748-9326/ac4d4f.
Neal J., Hawker L.P. et al. (2023): FABDEM V1-2. University of Bristol. DOI: 10.5523/bris.s5hqmjcdj8yo2ibzi9b4ew3sn.
ISBN: 978-92-1-113076-8. Link.
Hoffmeister O. (2020): Development Status as a Measure of Development. United Nations. DOI: 10.18356/a29d2be8-en.
United Nations — Department of Economic and Social Affairs — Population Division (2025): World Urbanization Prospects: The 2025 Revision. Online Edition. Link.