Field guide
Preamble
This field guide is aimed at anyone who wants to implement Environmental Surveillance. It should be treated as a resource that can be useful to help obtaining a first overview of the sewerage situation. It is not an exhaustive guide and it’s main purpose is to aid obtaining reasonable sampling sites. It does not deal with any aspect that follows site selection (such as sampling, laboratory analysis etc).
Understand the general situation
Before collecting any actual data, take some time to gather general information about your AOI. This will help you build a mental model of the specifics of your situation, such as:
Are you going to sample a mostly open or mostly closed sewer network?
What fraction of the population of your AOI is connected to the sewer network?
Is the network of your AOI draining mostly by gravity, or does it rely on pumping stations?
This section hopefully gives you a primer to think about all the relevant questions you should be able to answer about your AOI.
Identify actors
In most AOI, the sewer network is managed by public authorities in charge of water sanitation (which is sometimes also responsible for water supply). They are sometimes local (district) authorities, sometimes city authorities, sometimes national authorities. You should identify these public authorities and assess if they are willing to collaborate with you. This is critical, since you might be able to obtain a map of the existing sewer network through such a collaboration. Additionally, they may also discuss any potential plans about the renovation and extension of the network.
In addition to public authorities managing the network, you might want to identify actors conducting construction work on the network. They often interact closely with public authorities, but might be private engineering companies having their own registry and map of their work.
You might also want to identify financing actors that fund renovation and extension programs. In LMIC, they typically are foreign entities like the World Bank.
Finally, try to find other interested parties that might already have done some of the work you are about to do: other local or international research teams, former actors involved in the initial setup or funding of the network, etc. They might be useful in understanding the dynamics of the network: how it was initially meant, how it evolved with time.
Sewer network
Sewer networks can differ in many ways. You need to learn how the network of your AOI looks. Here is a list of characteristics of sewer networks, each of them provides a different angle to look at the network of your AOI.
How many networks cover your AOI? Is there really only one fully-connected network, or are there several independent networks that never cross?
Is the network converging? Ideally, the network(s) should drain to a few well-identifiable major outlets.
Where are the WWTP of your AOI? How many are there? Are they functional? Which districts are draining to which WWTP?
Are there pumping stations in the network? If so, how many and where? Are they pumping 24/7, or only under specific conditions? Are they creating flow in flat areas with no gravitational flow, or pushing flow uphill against gravity?
Formal vs. informal. Most sewer networks in LMIC are a mix of formal and informal structures that accumulated with time. Is the network of your AOI mostly formal, mostly informal, or a mix of both?
What flows in the network? Is it purely sewage, or a mix of surface runoff and sewage? If surface runoff and sewage mix, is it because of few surface inlets, or lots of them?
How are people living in your AOI connected to the sewer network? Are all buildings connected to the network as they get built? Are they all connected to the network, or only a fraction? If only a fraction of the buildings are connected to the network, what proportion of your AOI do they represent? Are the connected buildings distributed equally over your AOI, or spatially segregated?
Are some buildings using septic tanks? If so, does it also happen that septic tanks were connected to the network? Is it possible that some of the septic tanks separate liquid and solid waste and potentially the liquid waste still drains somewhere? If the tanks are emptied by trucks, where do the trucks dispose of the sludge? How often? Is there a fixed schedule and registry for those truck routes that you can get your hands on?
Are there easily identifiable sewer features visible from above ground? It could be manholes, drains, ditches, inlet grids, etc.
Are there other networks running underground? Can you tell their visible features apart from the sewer ones?
Demographics
Note
Consider this section as useful information for WES - it’s not strictly part of this guide.
WES being essentially about relating sample results to identified upstream populations, you need to get at least a basic understanding of the demographics of your AOI.
Notably, try to identify the key areas of your AOI: main transit hubs, health facilities, housing districts, office districts, slums, etc. This should help you choose the best locations to set up sampling sites once you get a good model of the network.
Also, try to get a basic idea of the population flow at different time scales: when are most people commuting from home to work? When are they commuting back? Are they commuting from the suburbs into the city in the morning, and back in the evening, for instance? Are there days where most people do not go to work and stay home? This should all help you set up a sensible collection schedule for your sampling sites and also help you interpret the sampling results.
Getting datasets of population distribution (see the Population data section) or built-up areas might help you figure out whether there are more densely inhabited districts in your AOI.
Surface hydrology
Parts of the sewer network of your AOI might flow gravitationally, so you need to get an understanding of the overall situation of surface runoff in your AOI. Some areas might have an almost constant slope consistently draining water from uphill down to the sea for instance, while other areas might be mostly flat, and others might be organised in several sub-areas around a network of large rivers traversing the area.
Getting even a coarse DEM of your AOI (see the Public DEM section) might help you visualize the main drainage direction(s). Also look at a map of local rivers and how they are flowing.
Dynamics of the situation
Be mindful that all the data you have collected so far and all future data you will collect is bound to evolve with time. Hopefully, you connected with people that can help you keep track of these changes as they happen, or can at least provide you with updated data when you ask them. You might still want to monitor significant changes in your AOI, like major construction projects that aim at renovating and/or expanding the existing network, construction of new districts that will get connected to the network, addition of pumping stations to the network, renovation or addition of WWTP, etc.
Get a map of the existing sewerage network
Modelling accurate upstream catchments of WES sampling sites requires the best possible map of the sewer network of your AOI. Now that you got a basic understanding of the general situation of your AOI, you are ready to move to one of the most important tasks on the roadmap: mapping the existing sewer network of your AOI.
What you need
A map of the sewer of your AOI is essentially a collection of sewer lines (sometimes also called “blue lines”): pipes, drains, ditches, river arms, etc. For each of these lines, you want to know:
its path (geometry), the more precision, the better
the direction of the water flow within the line
if it is “open” (water flows on the surface, in an open structure like a drain or a ditch) or “closed” (water flows in a sealed pipe, be it underground or not)
Optionally, you might also want to know which lines are trunk lines. Trunk lines are usually big main collectors where water flows uninterrupted for long distances, usually to a treatment plant.
Together, these lines compose the sewer network of your AOI. To ensure that this network is a solid foundation to future analysis, you should check that:
The lines are all well connected. Small gaps between the lines mean that they will be seen as individual segments by all downstream analyses, and water will not be modelled to flow through them.
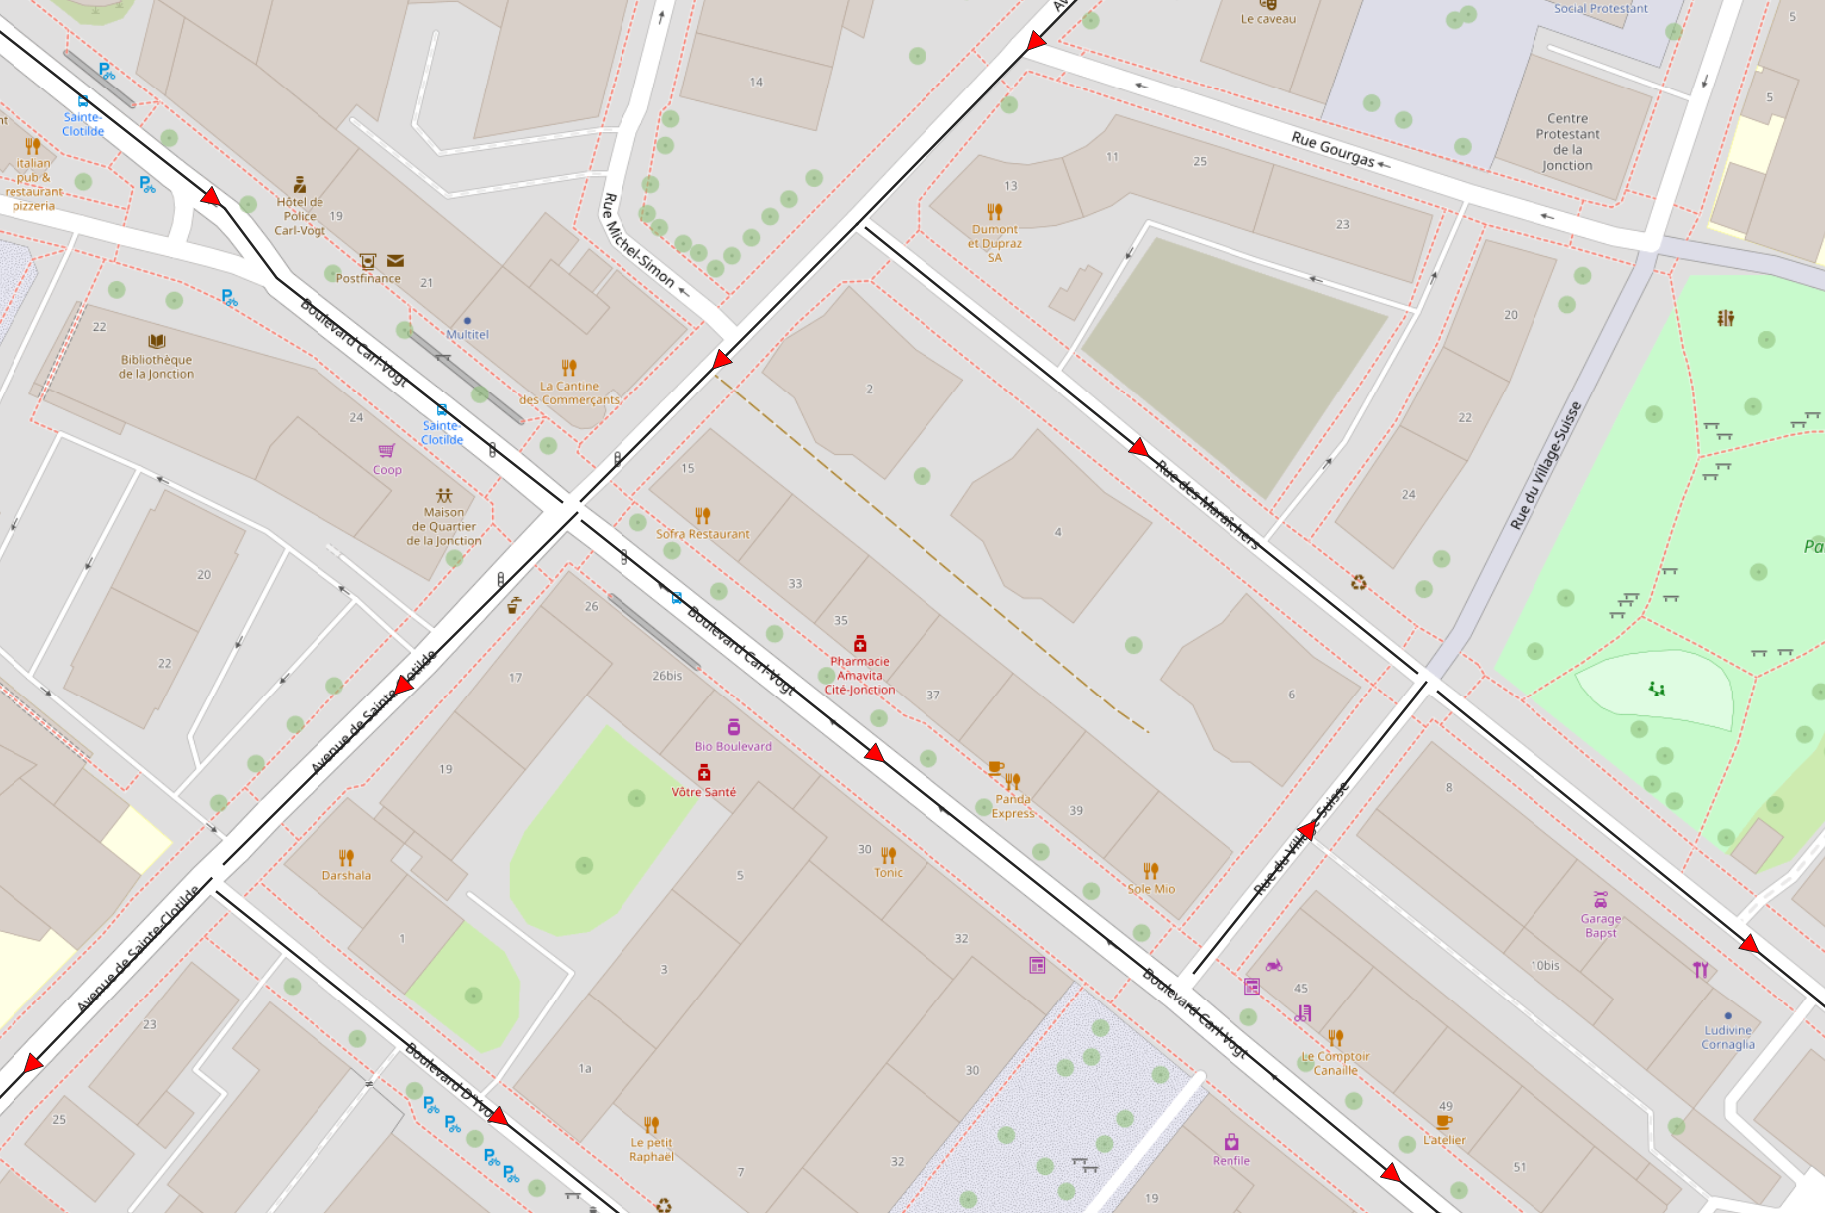
Example of a network with unconnected lines (black arrows).
The directions of the sewer lines reflect the direction of the water flow within the line.
The exits of the network make sense to you. They should ideally be the major outlets of your AOI: a WWTP, a river, a trunk connection to another network, etc. You should double-check that you have no “dead-ends” in the network, where the flow of water would suddenly be “blocked” for no real reason.
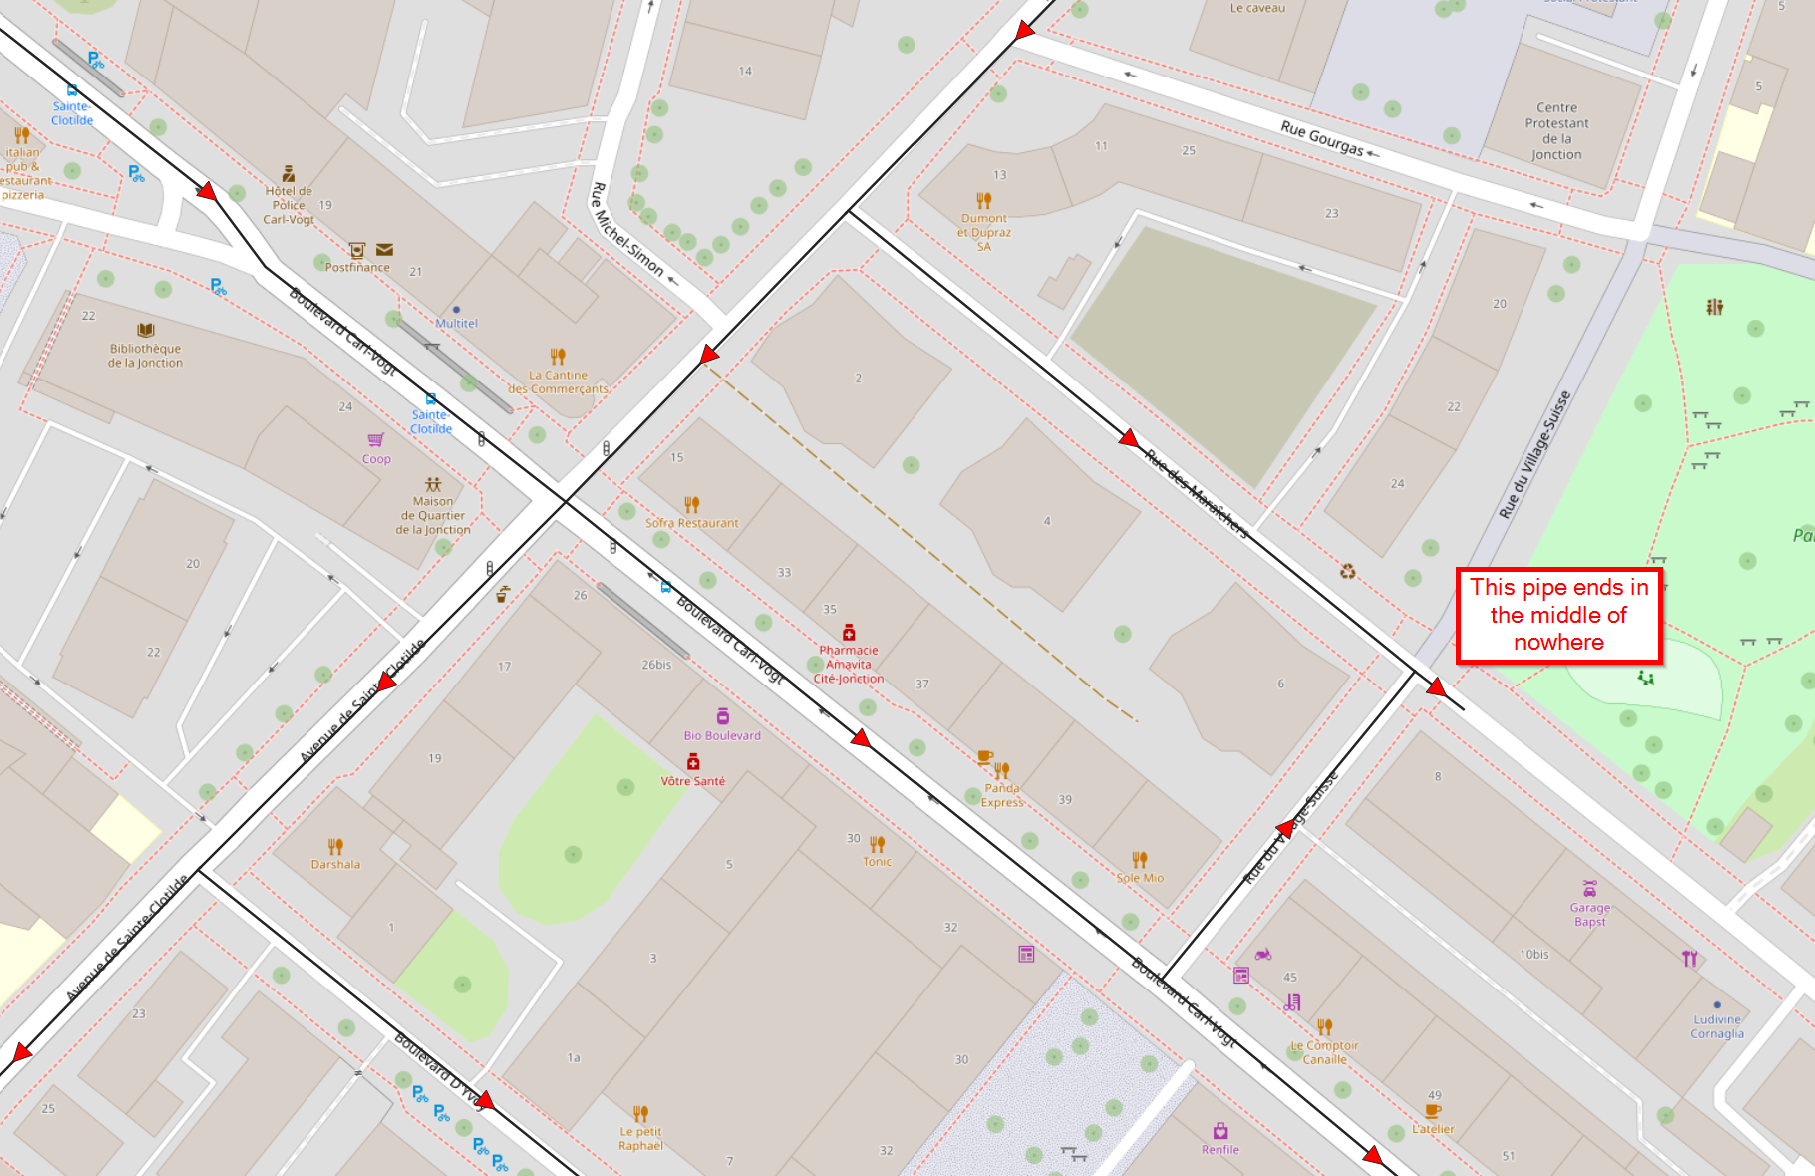
Example of a pipe ending abruptly in a place where it does not seem to make sense.
There are no obvious circular flows in the network (lines that would circle around a block of houses for instance).
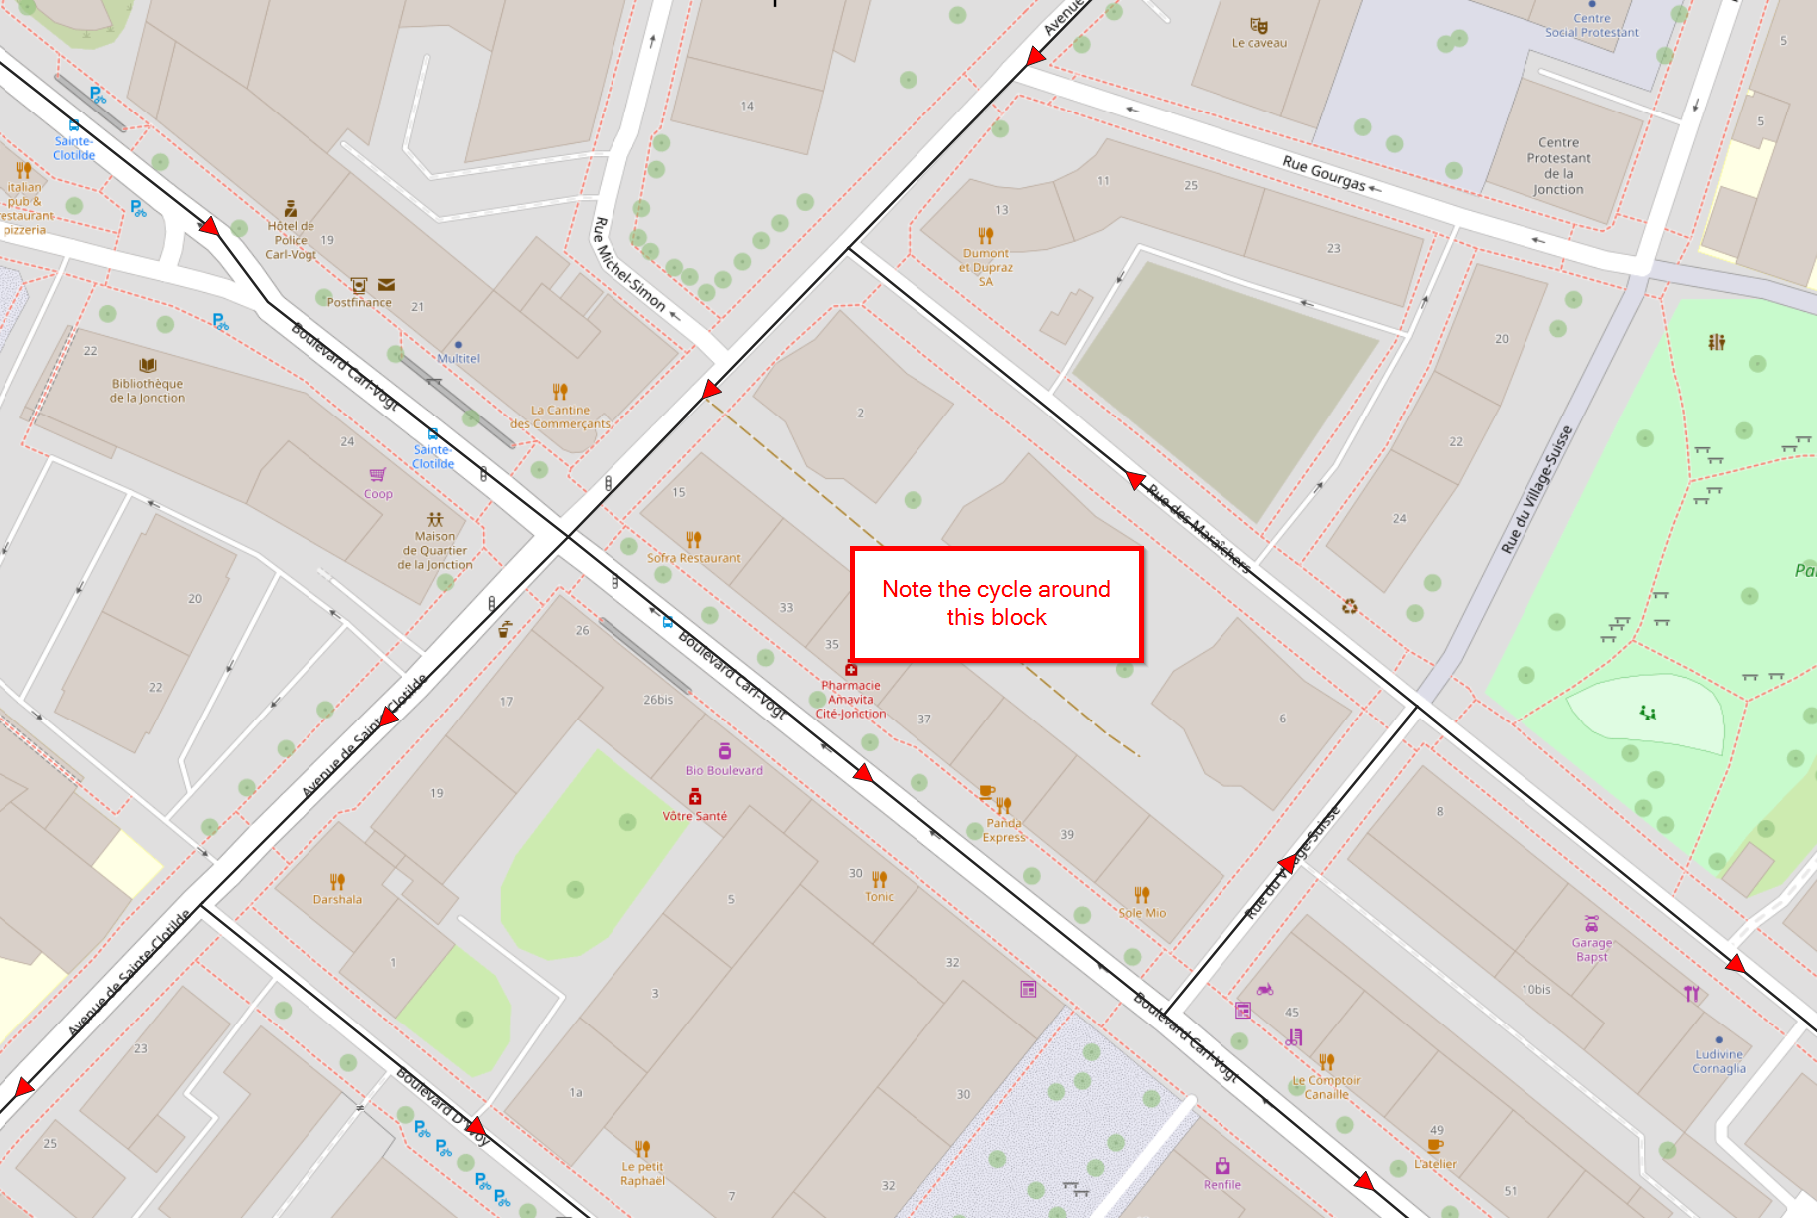
Example of an obvious circular flow within the network.
How to get a sewerage infrastructure map
Manually
Mapping a sewer network manually typically involves walking along the sewer lines while holding a GPS device. If using a phone, an ODK form can be used, which allows providing useful metadata about the sewer lines while also mapping their location. Depending on the situation (for instance dense urban areas with high-rise buildings), GPS signal alone may not be accurate enough and mapping using paper maps might be required.
You can find more information on how to collect data via ODK for this purpose here.
The easiest way to map a sewer network is probably by starting from its major outlets. These can be WWTP, primary collectors pouring to a river, trunk collectors leaving your AOI, etc. This means that these are the first locations that you should invest time finding. Once you identified the major outlets of the network, you may start walking upstream from them, following sewer lines, branch after branch, until you reach the target coverage of your AOI. More instructions can be found in a dedicated SOP and more information also here.
While you walk along these lines, pay attention to the kind of stream you are seeing: is it pure storm water drainage (which you may chooose to not map, although this could be useful down the line anyway), pure waste water (not connected to the surface inlets), or mixed water (waste water mixed with surface runoff)? This information will help you later model the catchments more accurately by correctly typing the sewer lines.
You must also pay attention to the direction in which water flows within the lines you are mapping. Since you are supposed to walk upstream from the major outlets, you should mostly be walking “against the flow”. However, once you start walking some denser parts of the network with lots of intersections, this will be changing. Always look for visual clues indicating which direction water flows, in open parts of the network, through the inlets of manhole covers, etc. Sometimes it might be useful to interview people living nearby, and ask them if they have information about where their sewage drains to. If possible, map which houses are connected and which houses are not connected to the network (because they use a septic tank, for instance).
Where you stop mapping depends on your goals. If needed, you might be able to walk every sewer line up to individual houses and buildings, even if this is often hard. Keep in mind that such a precise end-to-end network might not prove that useful to you in the end: what you are probably trying to do is to model upstream catchments of sampling sites capturing thousands of people, based on elevation and population rasters having a resolution in the order of 50 m² — 10.000 m² per cell. Unless both rasters have a very high resolution (< 100 m² per cell) and you have a vested interest in individual-building statistics, you can probably safely stop walking upstream when you reach what feels to you like the end of the primary or secondary network, and avoid mapping tertiary lines.
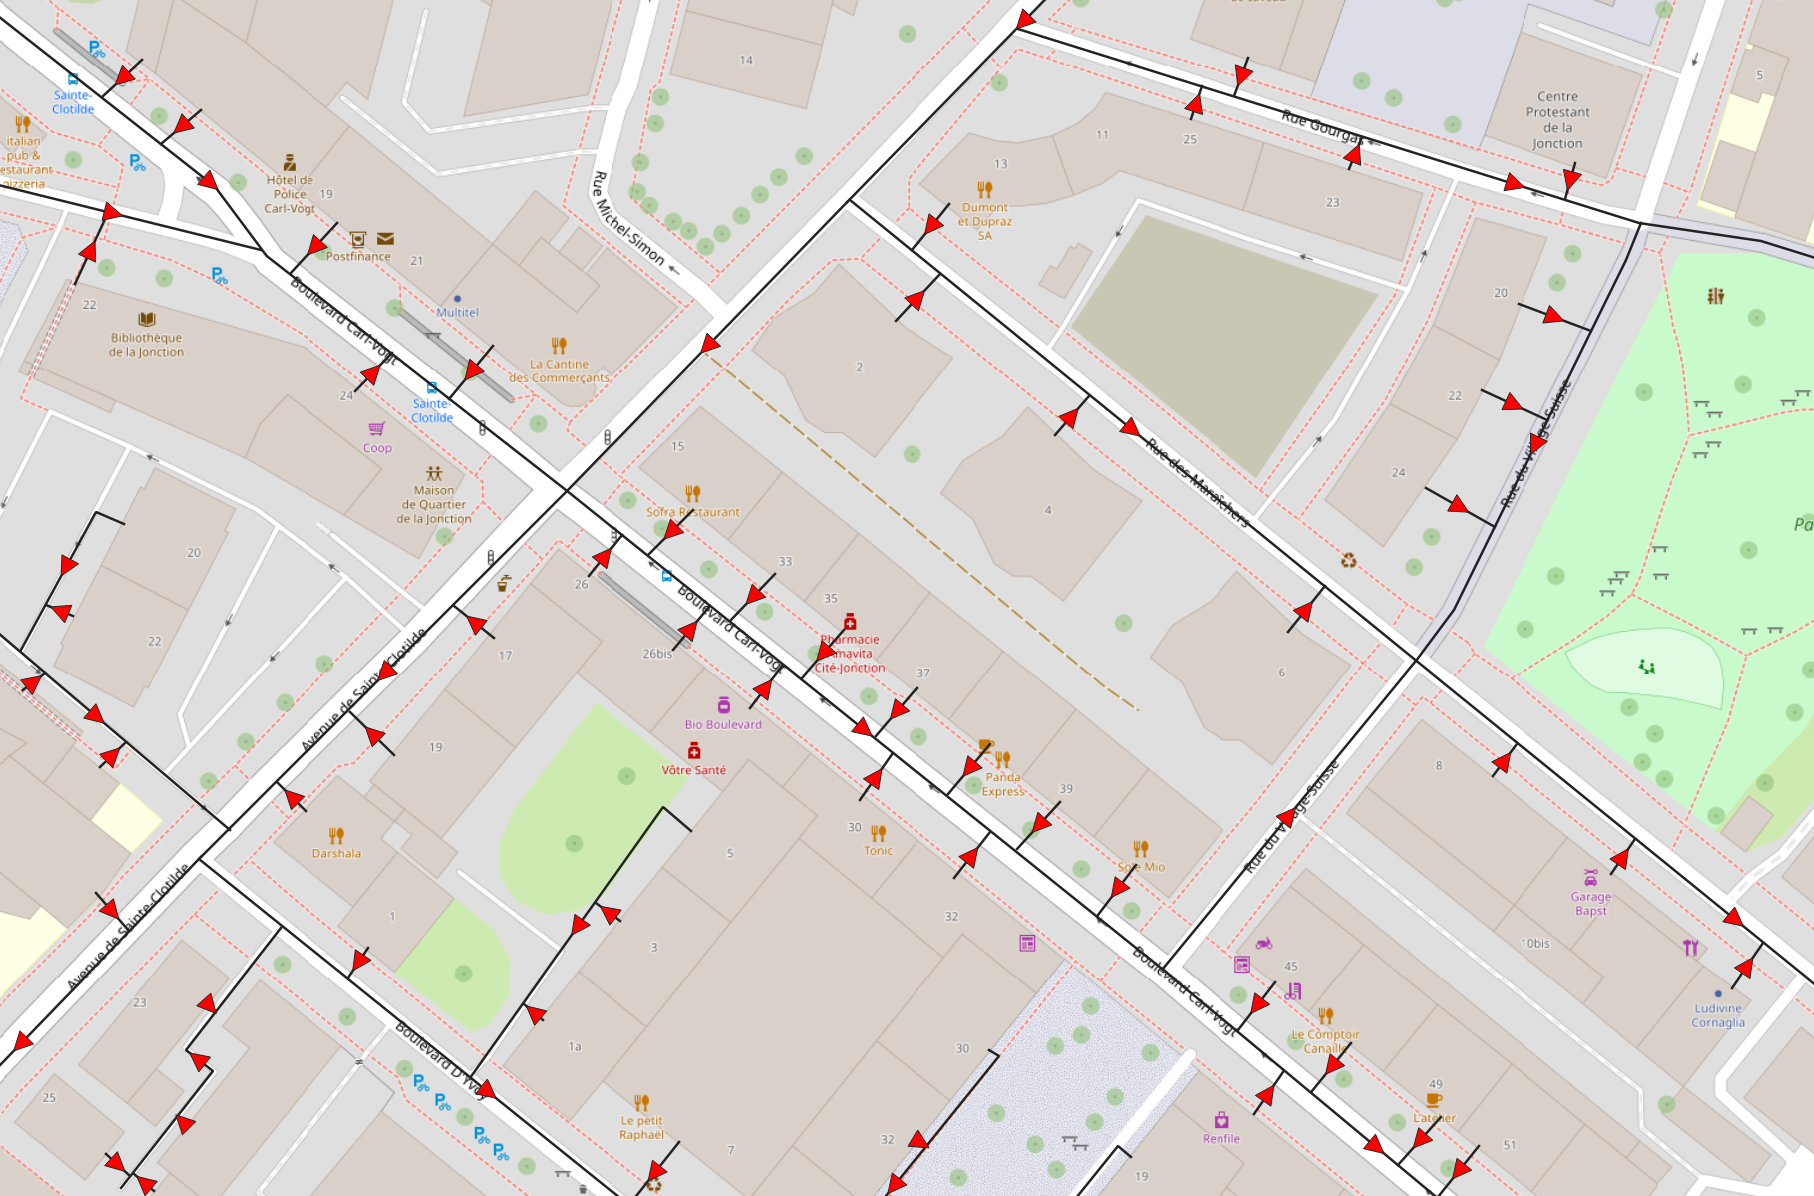
Unnecessary terminal connections to individual buildings.
Semi-automatically
Mapping a sewer network semi-automatically involves the acquisition of field imagery, the extraction of sewer-related features from the imagery and the automated reconstruction of a probable sewer network from these detected features. Depending on your particular situation, it might be a way to save time and work force in the initial mapping.
Two kinds of imagery are suitable for the detection of sewer features: ground imagery (like Google StreetView) and aerial imagery (often acquired by a UAV).
Note
Although satellite imagery is widely available, it is not suitable for the detection of more detailed sewerage infrastructure-related sewer features. The finest resolution of civilian satellite imagery is simply too low (about 30 cm GSD) to spot small objects like manhole covers. Mapping of major open drains could be feasible, depending on the quality of the imagery available.
Ground imagery is often easy to acquire, both technically and legally, requires little training for the operators and the equipment is not very expensive. It is typically acquired with a geolocated 360° camera mounted on anything: a car, a motorbike, a bike, a rickshaw, or even a pedestrian. The raw images or videos are then extracted, preprocessed, and passed to an AI model that was trained to detect features related to the sewerage infrastructure. From these geolocated detections, combined with terrain elevation data and the location of the network’s major outlets, a probable sewerage network is reconstructed. This network can (and should) then be reviewed manually and corrected where appropriate.
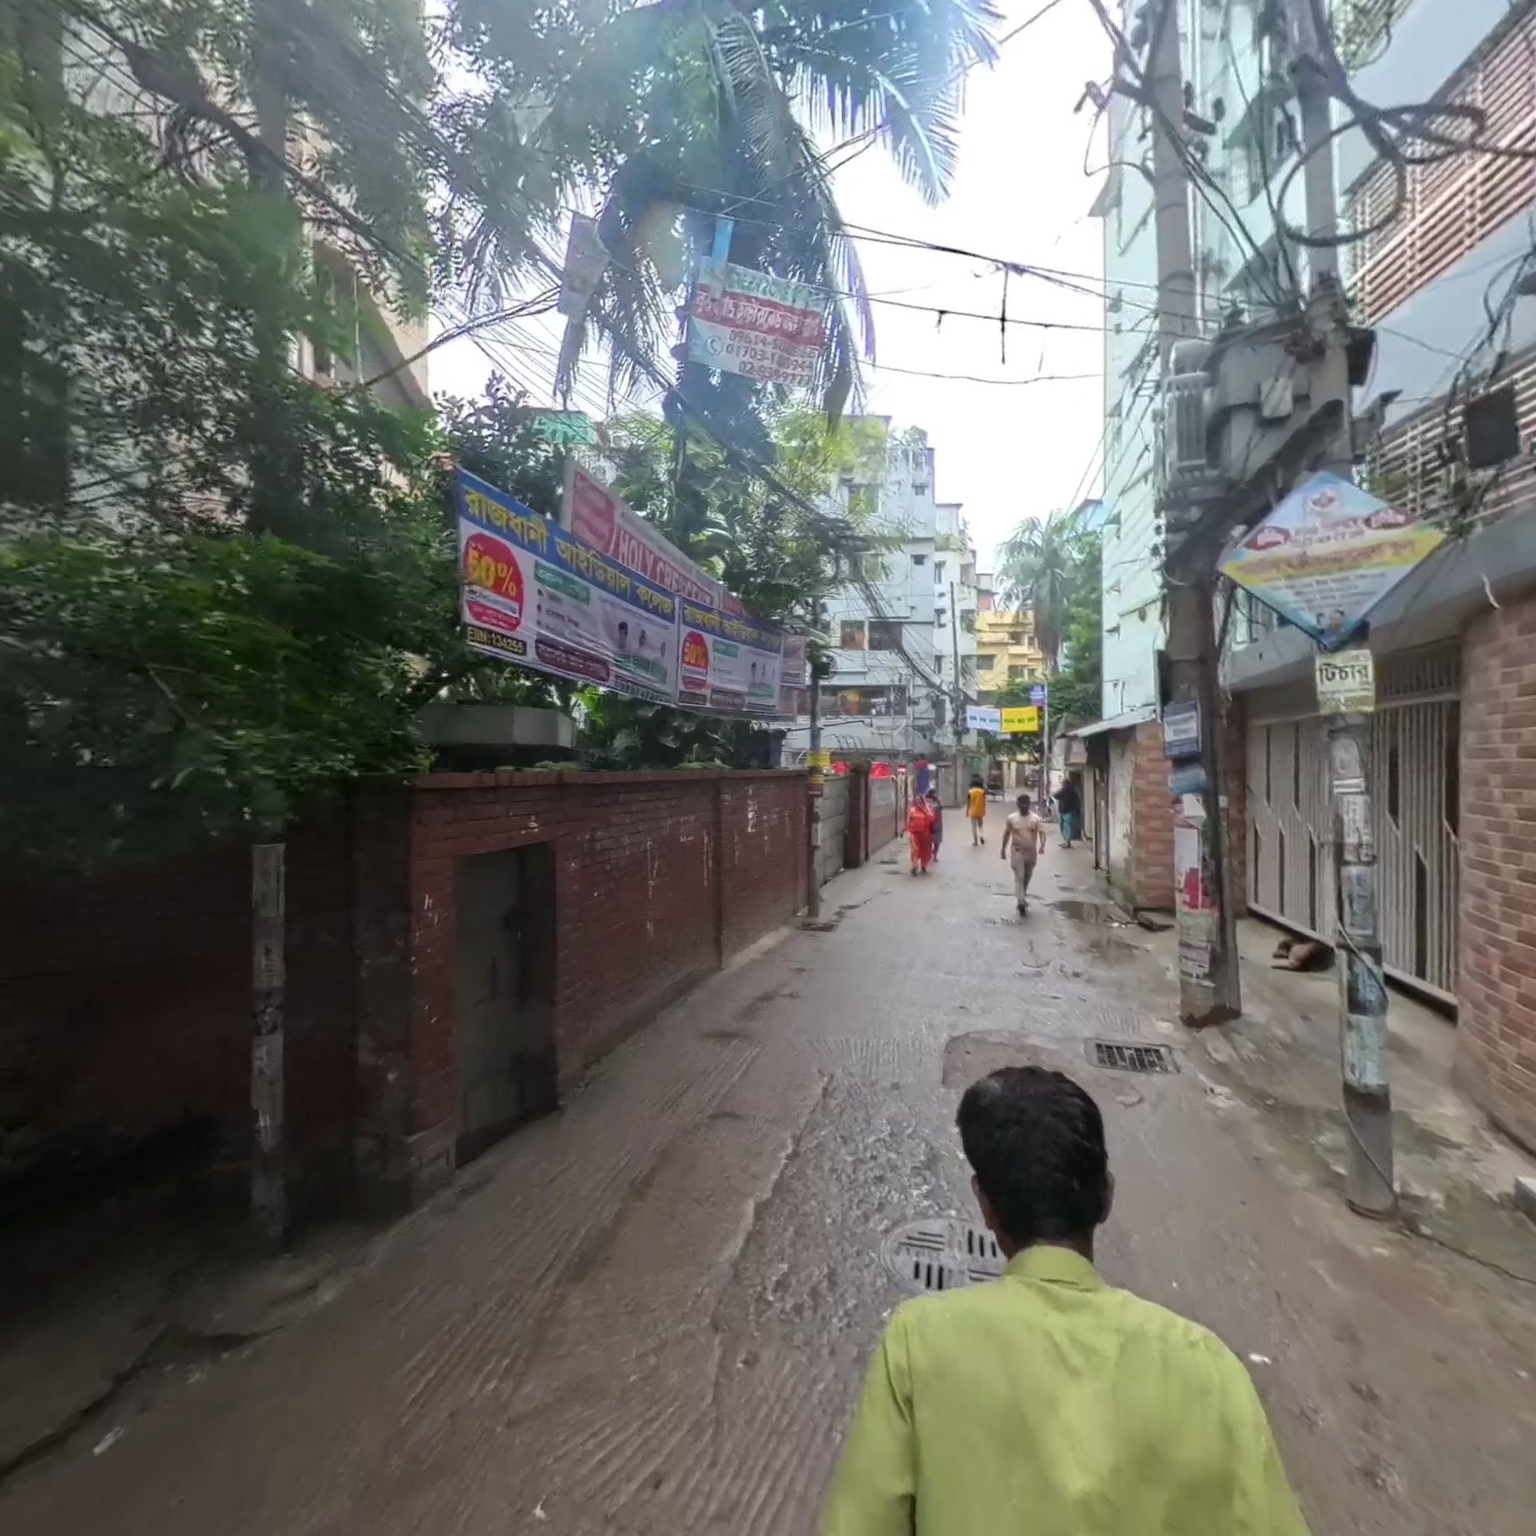
Example of ground imagery with visible sewer features
Aerial imagery is harder to acquire, both technically and legally. It requires extensive training of the operators, expensive equipment and legal clearance from multiple authorities. Once imagery is acquired, it goes through the same steps as ground imagery and produce a similar output.
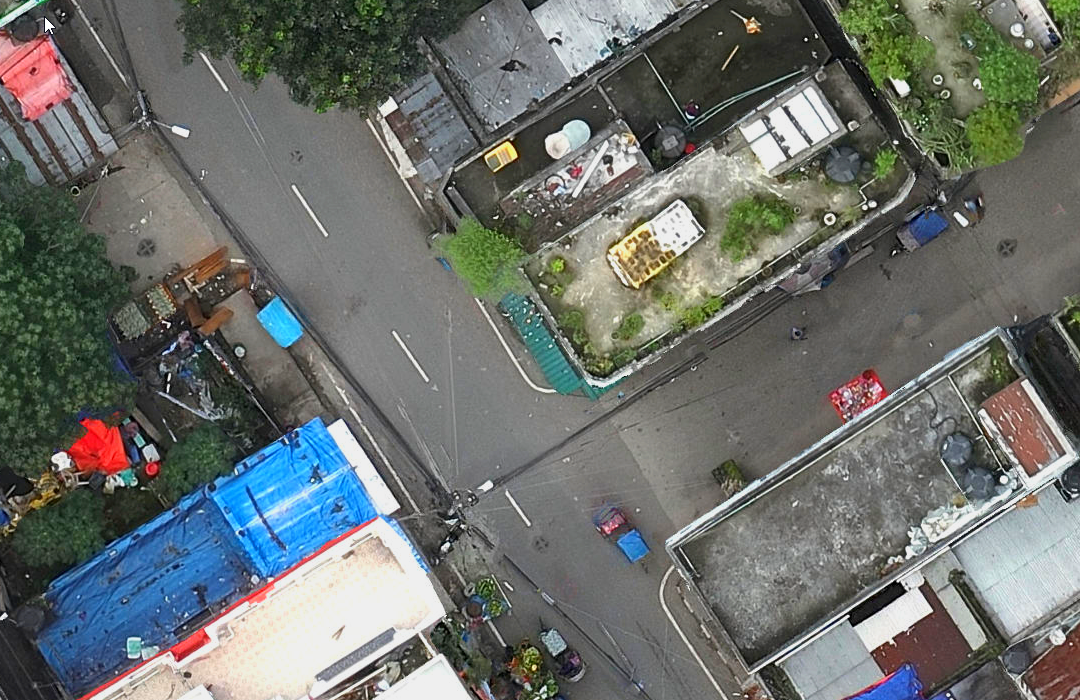
Example of aerial (UAV) imagery with visible manholes
Whether you should opt for ground or aerial imagery depends a lot on the local situation, below are some criteria that might help you decide. Note that there might be local or international companies specialized in acquiring such imagery which might help you gain precious time and ensure high-quality source imagery, dramatically improving downstream analysis.
Regardless of the type of imagery you choose to acquire, you should get in the field and take geotagged pictures of visible sewerage infrastructure features. This will allow you to detect them in the final imagery, which will be useful to fine-tune the detection models and to measure their performance.
Manually or semi-automatically?
Whether you should opt for manual or semi-automatic mapping depends on a number of factors. If you have time and field workers relative to the size of your AOI, you might want to undertake manual mapping. This will give you the most reliable results, and will teach you a lot about the sewer network while your team is out in the field. Sometimes, local limitations like restrictions to flying UAV or filming public spaces might force you to choose manual mapping.
If you choose manual mapping, this is the bare minimal set of information that you will need to collect in the field for each sewer line:
its path (geometry)
the direction of the water flow within the line
the type of line (“open” or “closed”)
See the What you need section for a longer discussion about data requirements.
On the other hand, if your AOI is big with respect to the number of field workers, or if you are short on time, you might consider semi-automatic mapping. This may be a particularly appealing option if you already know a local company that may acquire the imagery for you, and is used to get clearance from the authorities. Keep in mind that even with semi-automated network reconstruction, you will have to go out in the field to validate some flow directions predicted automatically but do not make sense to you for instance, or if you feel like some sewer lines were missed by the automated feature extraction. Additionally, automated mapping will miss information on which buildings are connected to a network and which are not.
If you choose semi-automatic mapping, you will need to acquire:
the location of the major outlets of the network (where does the network drain to?)
ground and/or aerial imagery of your AOI.
if the model struggles to detect your sewerage-related features and needs a bit of fine-tuning, some ground truth about what sewerage-related features look like in your AOI
See the Semi-automatically section for more details.
Get a list of existing sites
Note
If you know you are the first one setting up WES in your AOI, you obviously do not have to bother listing existing sites. You might still want to read this section to be aware of the data you want to keep track of for each site you are going to set up.
What you need
Depending on the status of local WES programs, some sampling sites may already exist in your AOI. If this is the case, you should try to summarize their information. For each site, you should try to obtain:
Its precise location. The more precision, the better the modelled upstream catchment.
If it is a spatially-composite site (where samples collected at close-by locations get pooled together), get the precise coordinates of all the sampling sub-locations.
Its name and code.
Is the site active? As in: is there still sampling happening at this site?
Its type. Is the site sampling water from a WWTP? From a river? From a canal? If sampling from a canal, is it closed or open?
Note
If you have limited effort to put into listing existing sites, just get the best possible location for each of them: this is the best thing you can do to ensure a reliable model of their upstream catchment.
A number of additional details might be of interest to you, that were not listed above because they would not strictly be useful for the modelling of the upstream catchment of a site. Feel free to collect them, as they might still be important to interpret sampling results, or simply help you keep an up-to-date catalogue of the sampling sites of your AOI. You might for instance think of collecting, for each site:
Is it a temporary (perhaps set up for a short project) or permanent site?
When did collection start at this site, and if it ended, when did it end?
At which frequency does sampling happen at the site?
Is the site a temporal-composite site (where samples taken at different times of the day get pooled together)?
What is the best/official estimate of the population count of the upstream catchment of the site? This number may be useful to compare to the number you get from the modelled catchment.
What kind of notable features are present in the site’s catchment? Schools? Transit hubs? Health facilities? IDP? Refugees? Low-immunity populations?
A template exists that lists what kind of attributes can be attached to a site on the ES world maps. This template can be accessed here.
How to get a list of existing sites
You should probably get in touch with public authorities in charge of water sanitation first, but also try to find other groups (university research teams, NGOs, etc.) involved in WES in your AOI.