Catalog
The catalog shows all published maps along with any sites associated with them as well as laboratories.
The catalog can be consulted in either map view or table view.
Symbology on the map
On the map, the symbology is as follows:
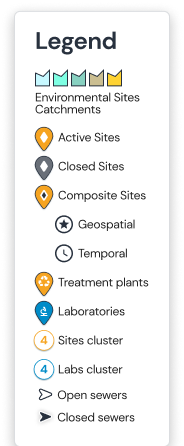
You can click on the icons to get more information for sites or labs.
Overview of navigation
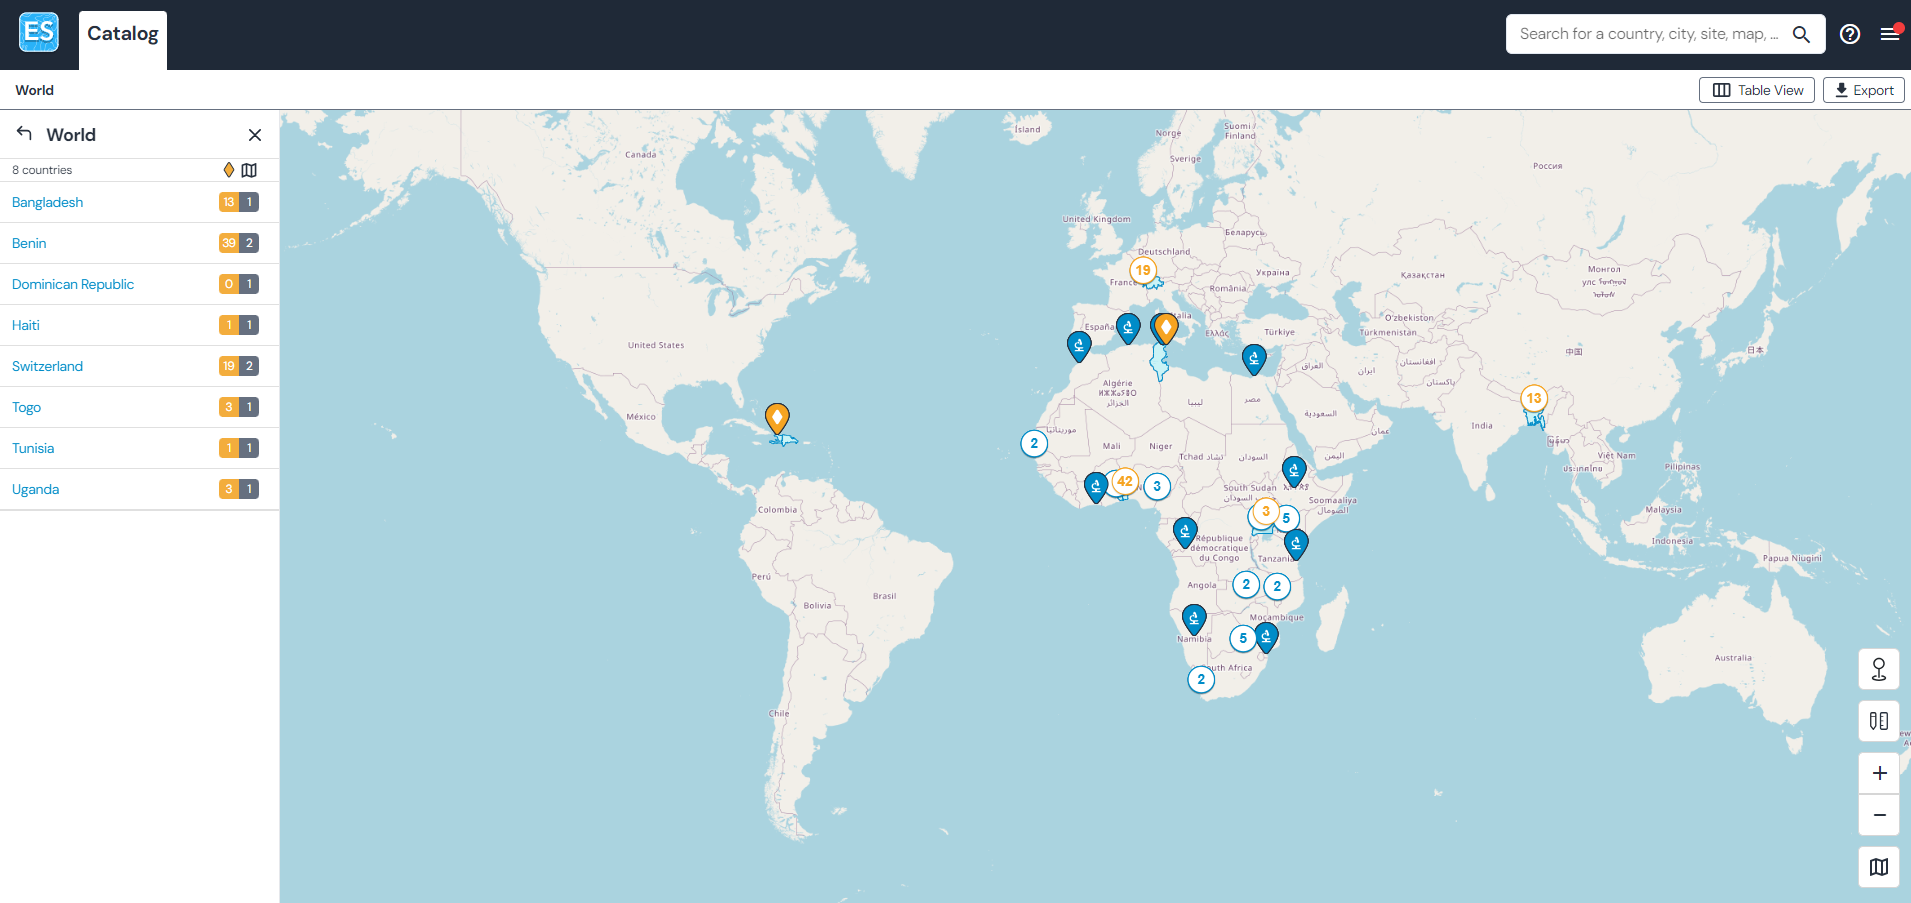
The map view allows to browse the world map and see where the maps, sites and laboratories are located.
Numbers on the map indicate sites, zooming in will reveal the site locations on the map. The left panel serves as a navigation as well. Yellow numbers indicate sites. Grey numbers indicate maps.
The table view allows to quickly get a glance of sites in an area along with their characteristics.
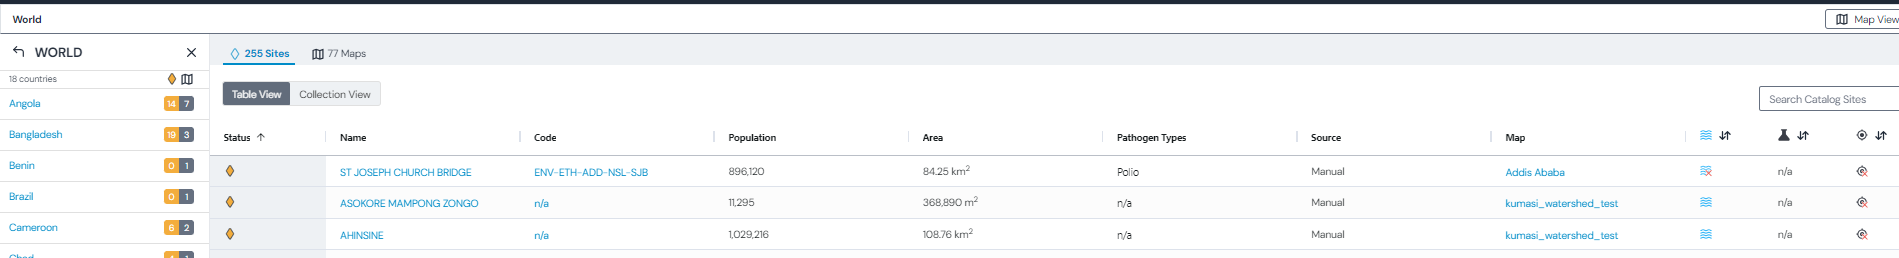
Explanation of the icons and columns
Icons in the table
Digitized water flow data is available for this site
Digitized water flow data is not available for this site
Specimen collection data is available for this site
Specimen collection data is not available for this site
Coordinates for this site have been verified
Coordinates for this site have not been verified
Site status column
Active site status
Closed site status
Postponed site status
Unknown site status
Population and Area columns
For each site, these columns refer to the watershed polygon of the site - how many people are within the watershed and the area column indicates the watershed size for each site.
Pathogen types
The types of pathogens sampled at the site location.
Source
This column indicates if a site has been uploaded by the map creator (in which case, the source is manual) or if it is a remote source, for instance WebIFA.
Map
This indicates which map the site is associated with. This is a link and can be clicked to get the details of this map.
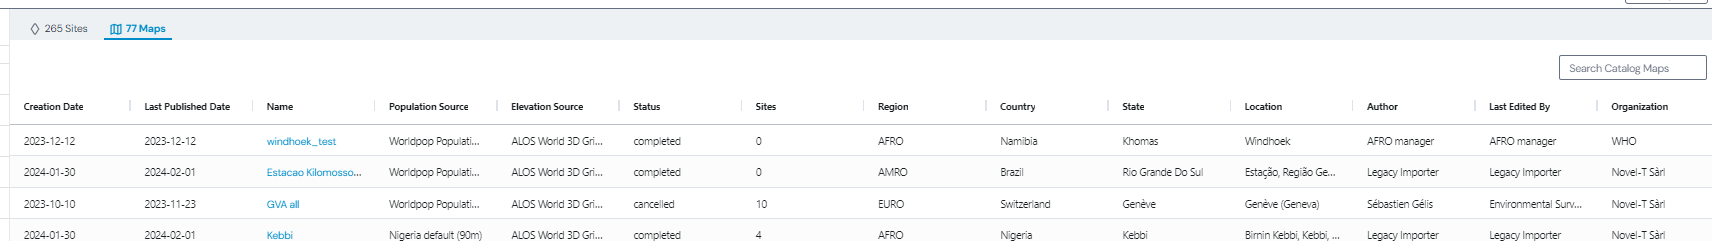
Hint
The map table lists all maps created on the catalog, along with author, organization and date information.
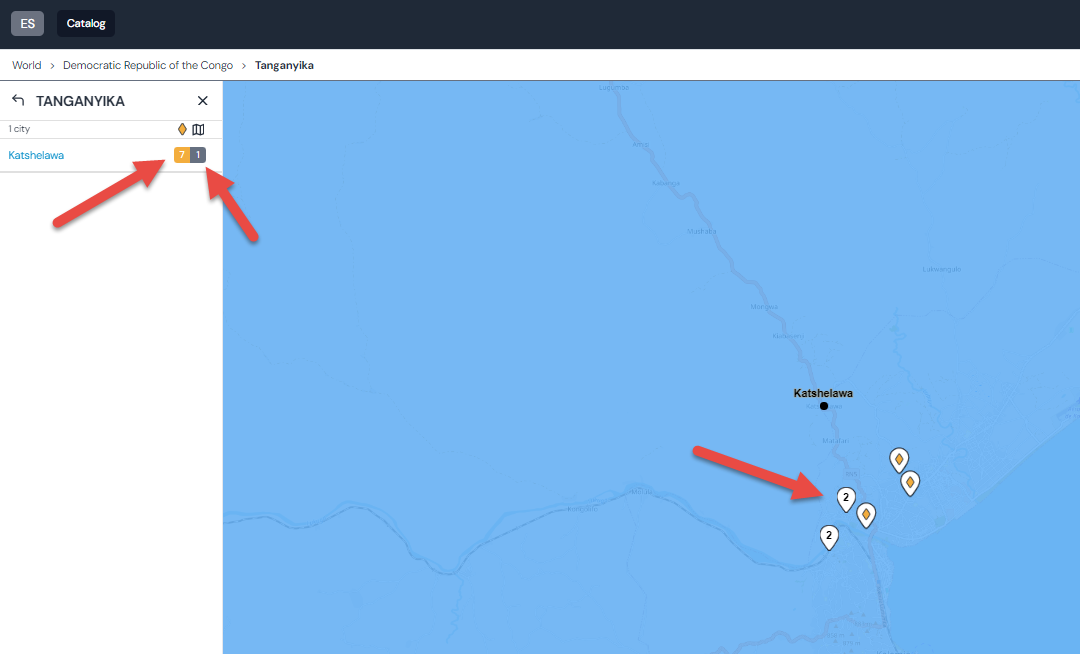
City view
If sites are present, the city view lists all sites associated with the city. Sites can be clicked upon to navigate to a site detail.
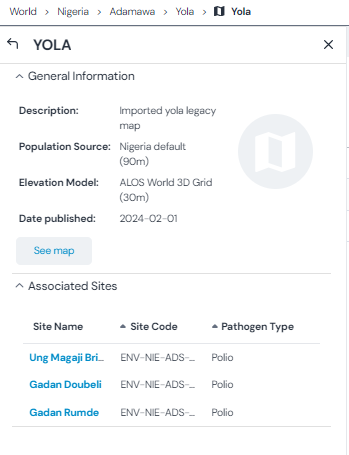
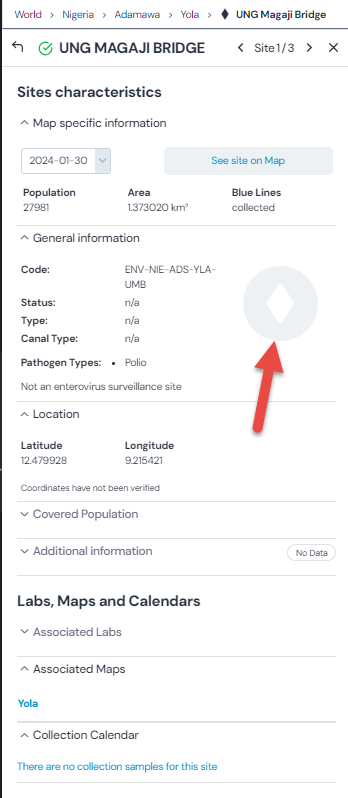
Site details
Accessible through the left panel navigation or else through clicking on a site name / code in the table view.
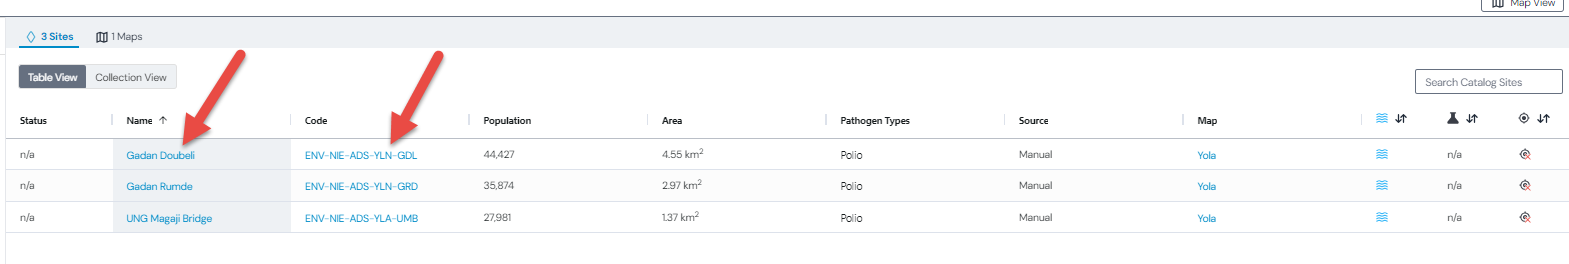
Hint
The site detail is easily distinguished from other details by the site icon (red arrow).
From the site detail you can easily see:
The metadata associated with a site (under the different sections in the site panel)
The population and area of the watershed associated with the site
The maps associated with a site (typically only one map)
Sample collection data if available (see Collection calendar)
Hint
A site can be part of several maps (example: if several maps are created for a city and each of those maps has one WebIFA site, this site is associated with all the maps it has been added to). Manual sites that are added to a map are always restricted to one map.
The population and area indicate the characteristics of the watershed for the site on that map.
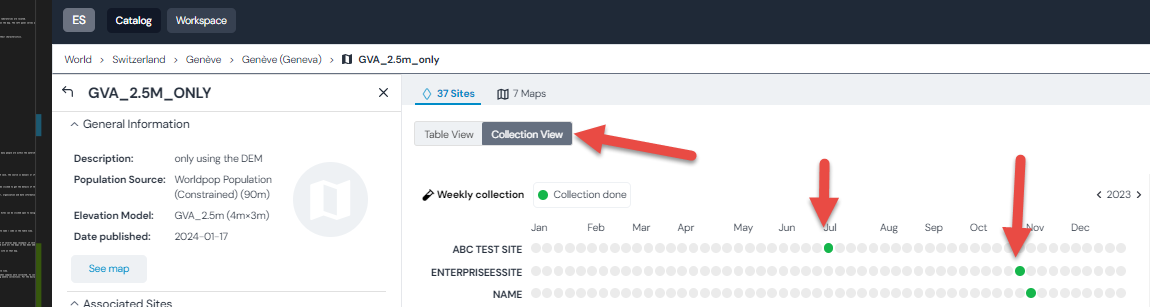
Collection calendar
Accessible through the left panel site detail navigation or else from the table view.
If sample information for a site is available, the collection calendar shows when samples were collected. To connect samples with your sites, see xMart. The collection view is showing weekly collections. For the daily collection view, consult the site detail.
Monthly collection view:
Daily collection view:
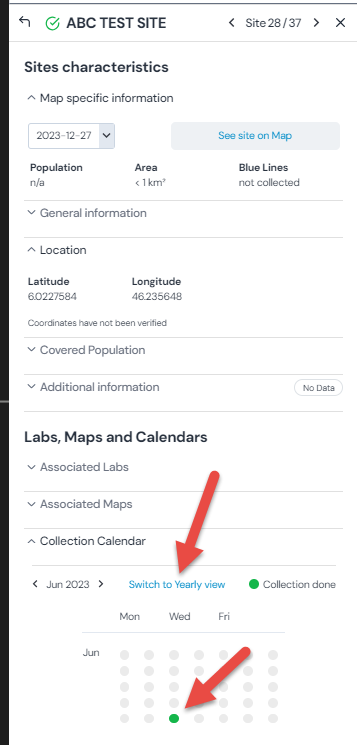
Hint
You can switch between the daily and yearly view on the site collection detail.
Map details
Accessible either from the left panel navigation or else from the table view.
The map can be accessed directly from the detail. Additionally, sites associated with a map can be accessed from here as well.
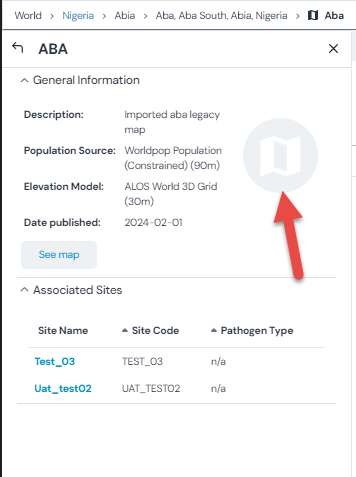
Hint
The map detail has a map icon to distinguish it from site details easily (red arrow).
Exports
Exporting data from the system comes via a batch export of sites, maps and lab or as individual layers, as described below.
Exporting sites, maps and labs
Click first on the ‘Export’ button on the top right.
Export sites
Export maps
Export labs
Select the format of the export - sites can be exported as GeoJSON, CSV or KML; maps can be exported as KMZ or shapefiles; labs can be exported as CSV
Select the geographic area to export - this list updates according to geographic level you are at (ie World, Country or City level)
Clicking export will generate the requested files
Exporting individual layers
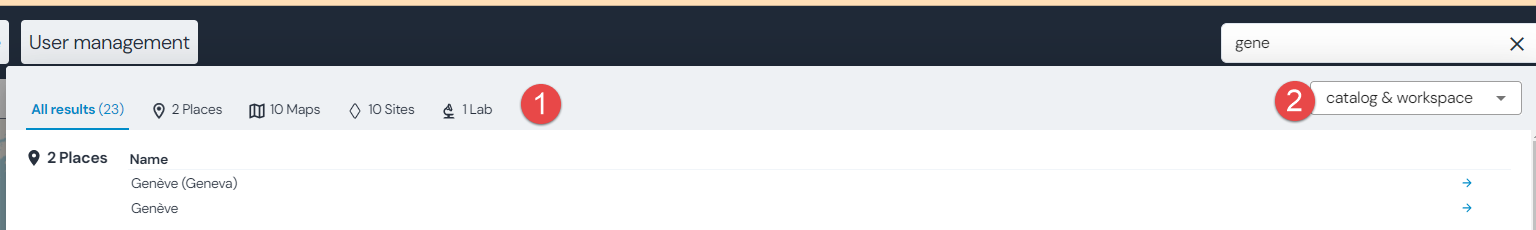
Search
The search is accessible from the top header.
Filter search results by places, maps, sites or labs
Filter the search to search within the catalog or workspace (when logged in)