Maps
The main purpose of this application is to allow people to identify suitable environmental site locations. In order to do that, a hydrological model for the area of interest can be generated by creating a map in an area of interest.
Important
A minimum of two datasets is needed to create a map:
A digital elevation model
A population raster
In the application, default datasets are available such that a map can be created at almost any place in the world. However, if available, individual datasets can be uploaded to improve the quality of the map, as described below.
Furthermore, the following layers can be added to improve the quality of the map:
Streams and rivers
Lakes
Barriers and exclusion areas
Sewage lines
To aid site selection, a set of tools will be available in a later version of the application. For the time being, sites can be manually added to a map, however, no watershed is delineated for those sites.
Map creation
Maps can only be created where a user has permission to create maps.
New map
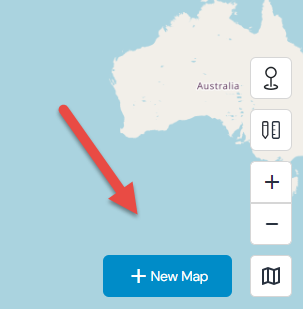
To create a map, you need to be logged in. Click on ‘New map’.
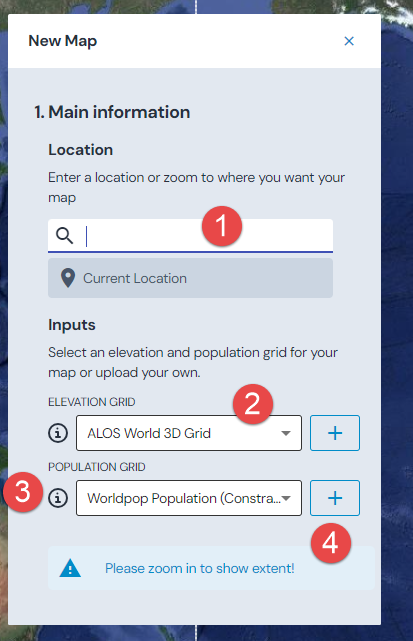
You can search for a location here.
Select the DEM here and population rasters here. The default rasters are ALOS30m for the elevation raster and WorldPop unconstrained for the population raster. FABDEM and SRTM30m as well as WorldPop constrained rasters are available as well. If you upload your own DEM or population raster, they will appear in the list here.
If you want more information about the source that is selected, click the ‘i’ icon.
To upload your own DEM or population rasters, click on the ‘+’ icon.
Important
The DEM and population rasters need to intersect, otherwise you will get an error. Upload limits apply: 2GB for population and DEM rasters. Additionally, they need to be in the EPSG:4326 projection.
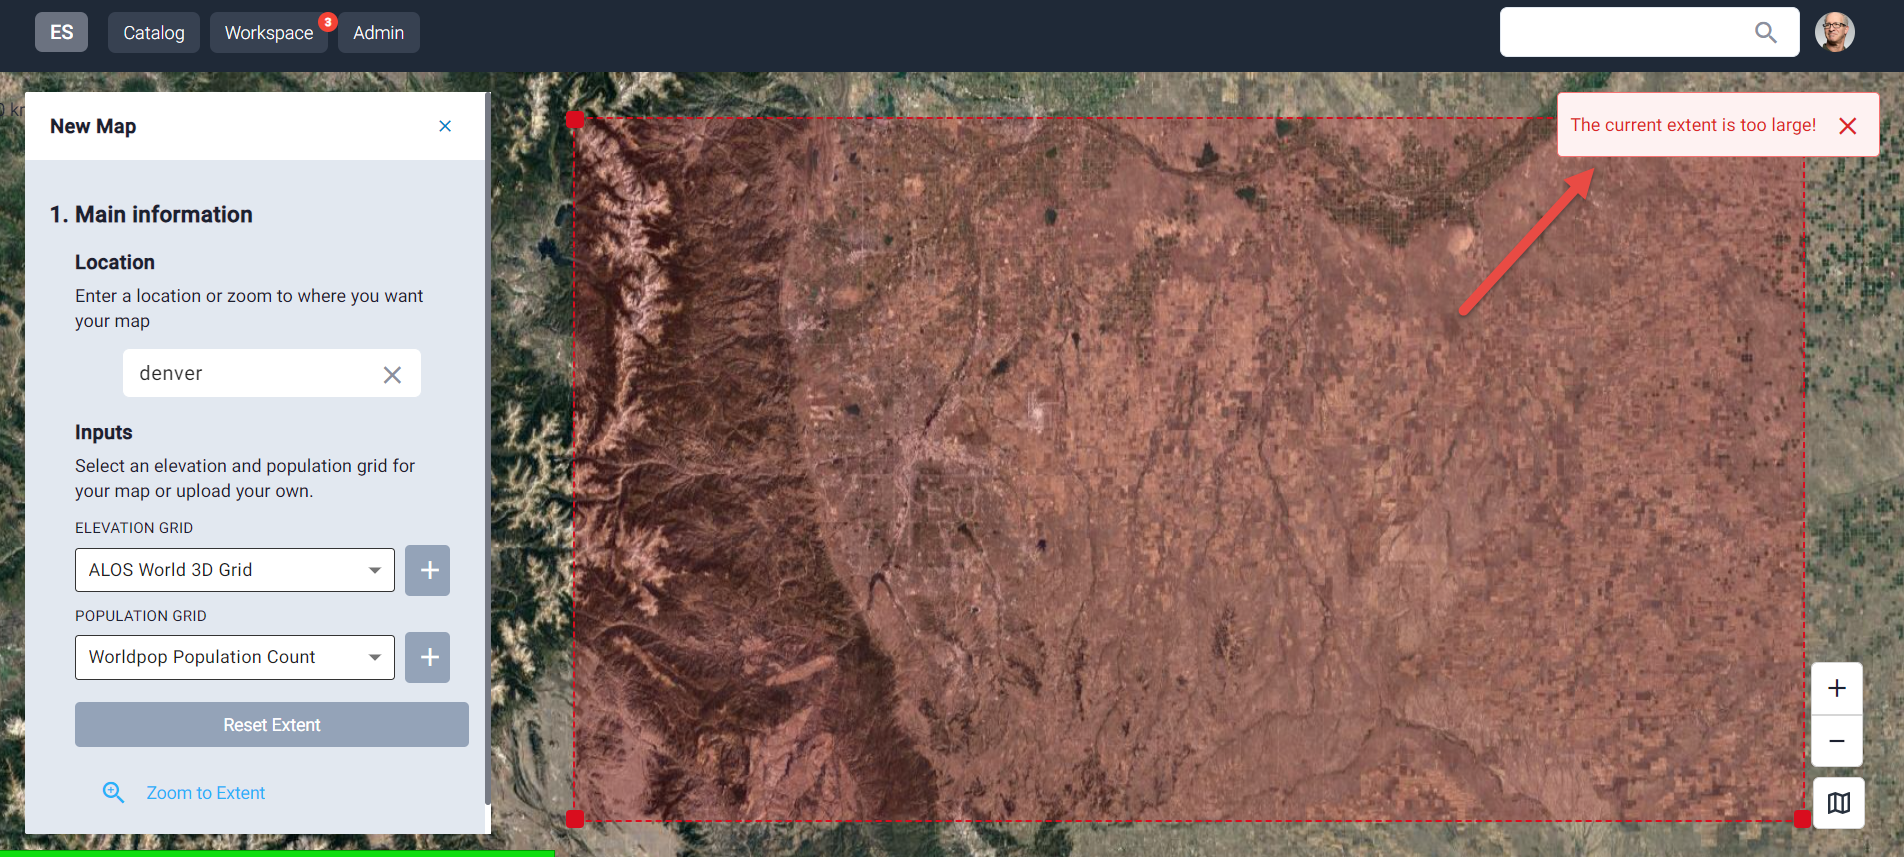
Different error messages will let the user know if an area cannot be selected. For instance, there are minimal and maximal extent warnings:
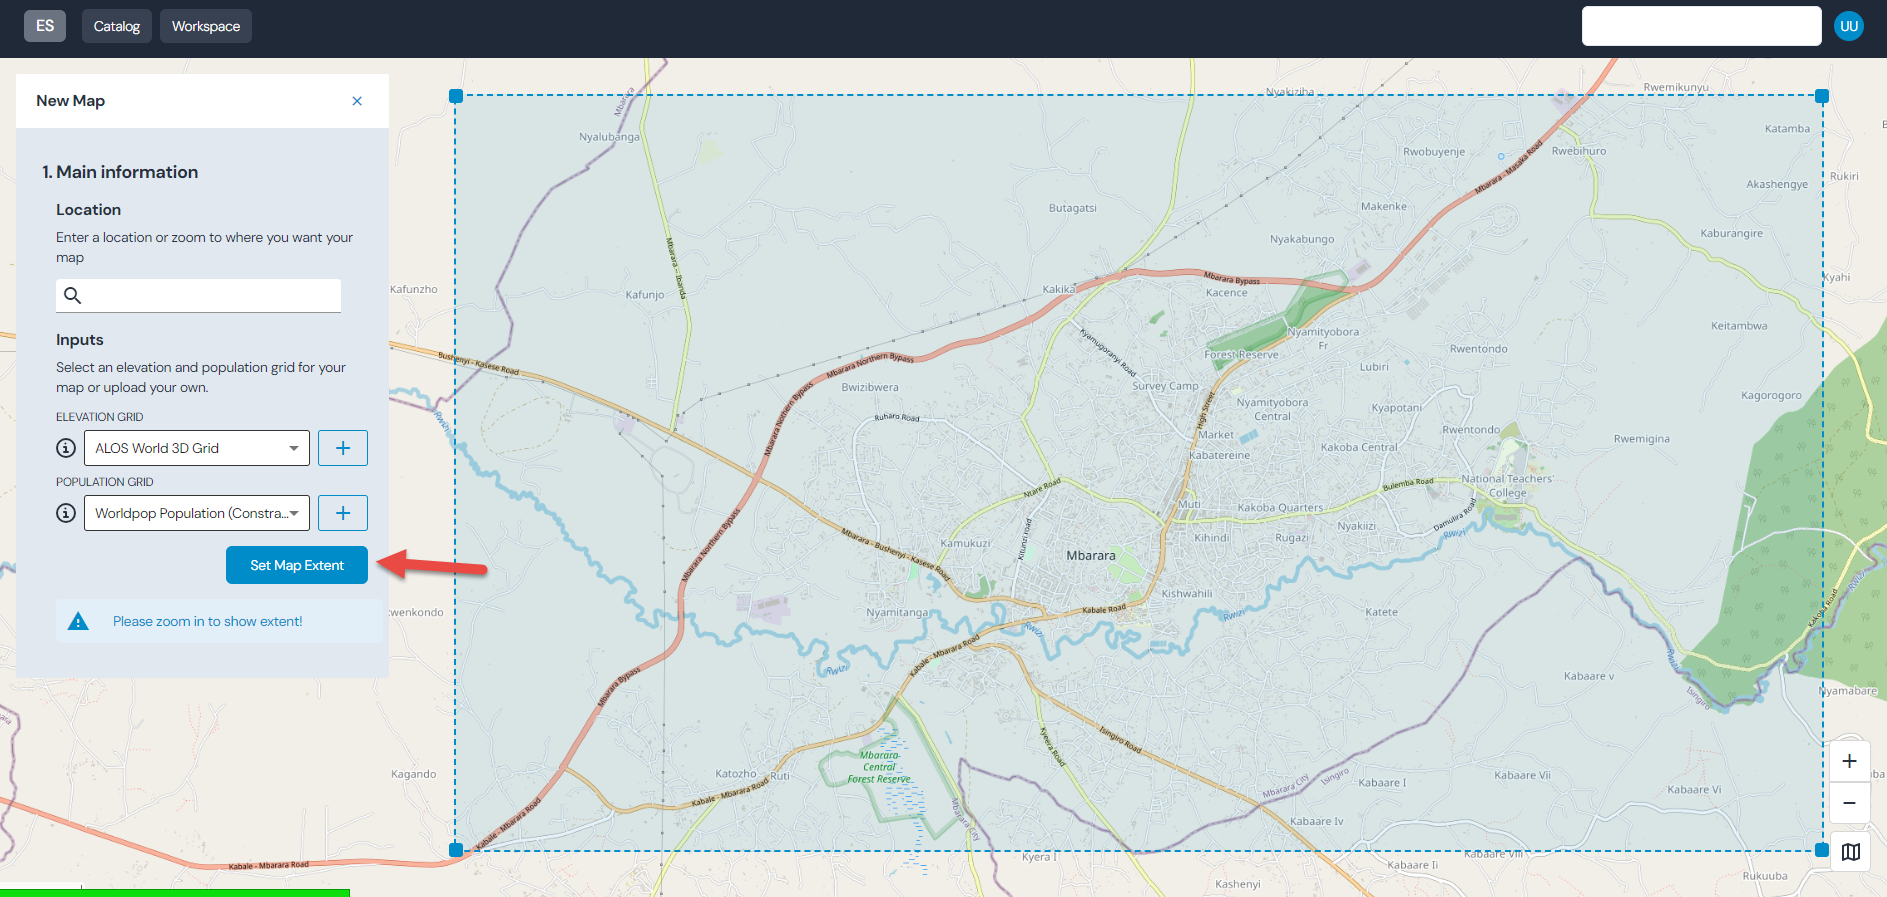
Set map extent
Once the correct extent has been identified click on ‘Set Map Extent’.
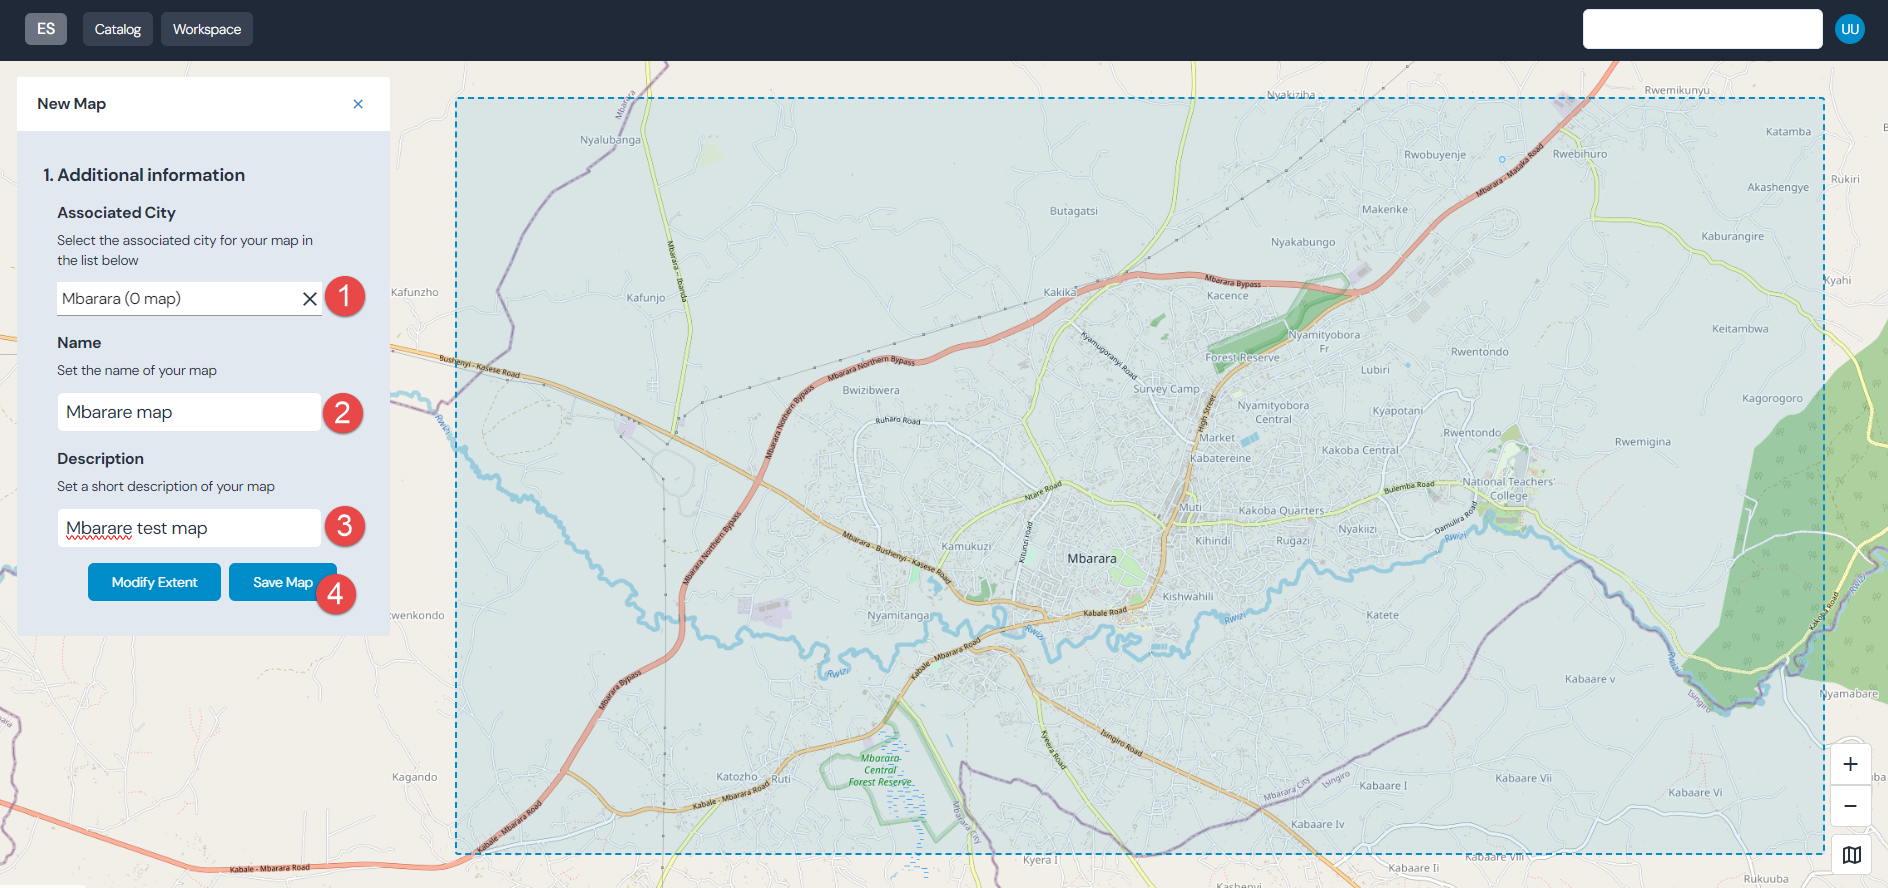
Select a location from the list - this is needed such that the map obtains automatically a location attribute. Note, you can search this list if you have multiple names.
Set a name for the map - this can be how you refer to this map and it will show up with this name in your workspace.
If needed, provide a description.
Click ‘Save Map’.
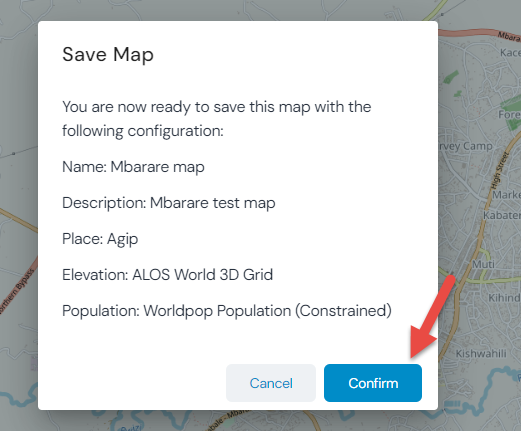
On the popup, click ‘Confirm’.
Important
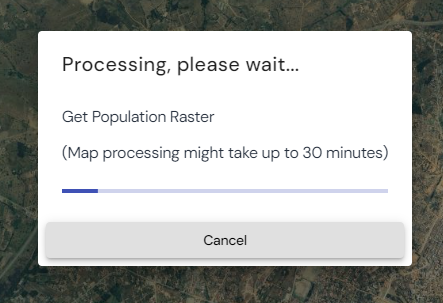
Once you have confirmed, map processing will start. As population and DEM data needs to be fetched, this process might take a while. A status is indicated.
Important
The most basic version of a map has now been created. To refine the map, more layers should be added if possible, such as sewage lines, rivers, exclusion areas etc.
Map viewer
The map viewer is the part of the application where site selection happens.
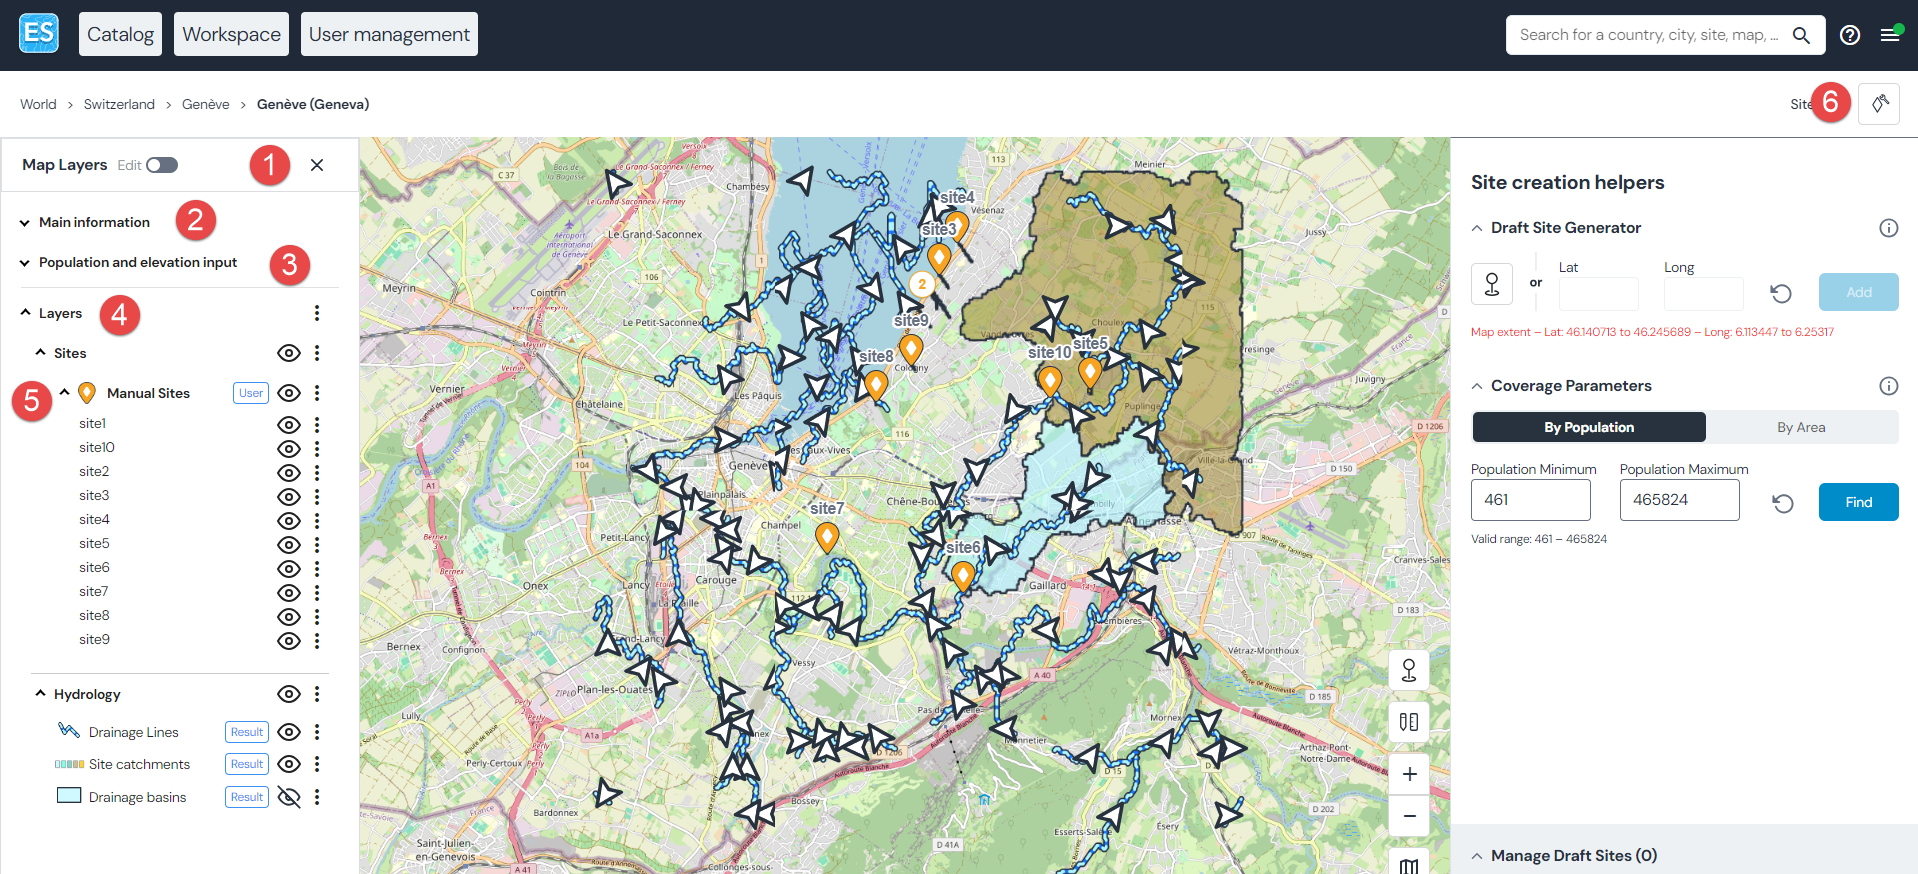
The left panel allows to show and hide information (can be collapsed via the cross)
Main information such as map name, processing date, editor and description can be consulted here
Show / hide population and elevation input
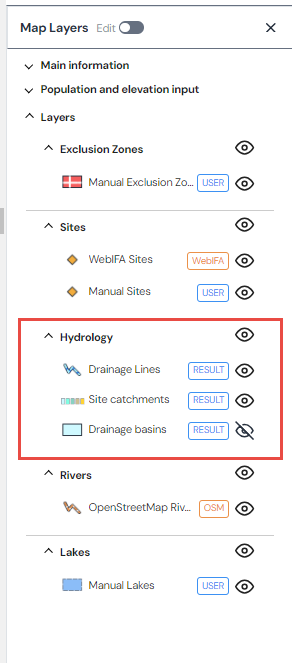
Show / hide layers and sub-layers (note, the ‘Hydrology’ section contains calculated layers, meaning those are the resulting layers from the map processing - these layers never show in the map editor)
Show the individual sites - the 3-dot menu can be used to zoom to a site
Show / hide the site creation helper tools - see Site creation helper for details on this
Site creation helper
This tool is to aid selection of sites.
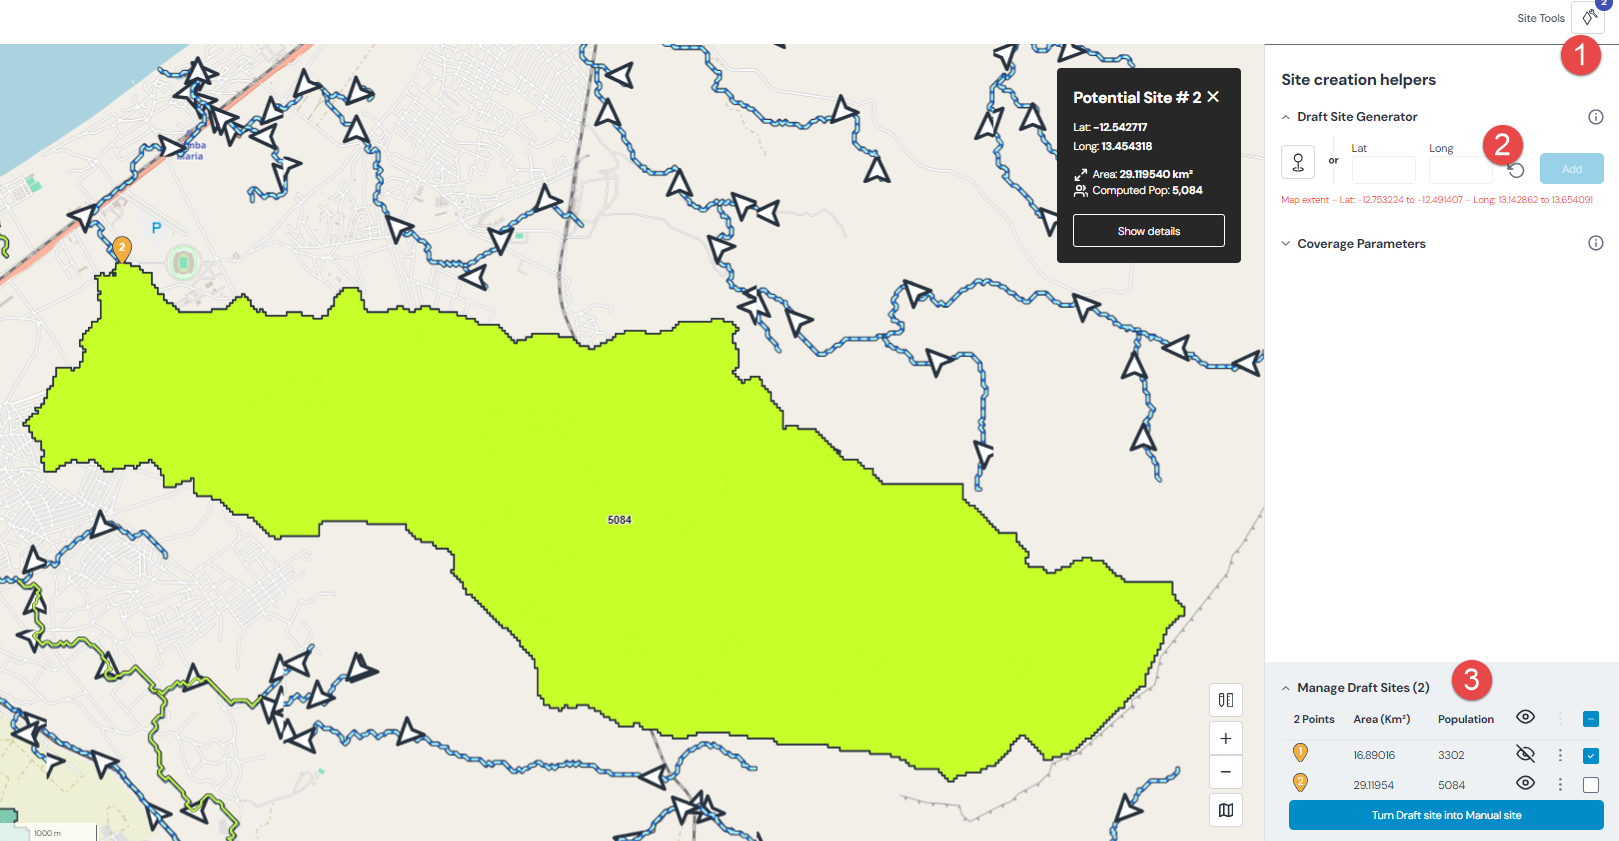
Draft site generator
Open the tool via the button
Delineate a watershed (i.e. select a potential site) via the pin drop or entering coordinates
This adds a new ‘Draft Site’ to the menu below
Coverage parameters
To aid the selection of sites, the coverage parameters can be utilized. A population or area criteria can be set to filter the possible locations.
For instance, if a site should sample between 10k and 50k people, enter these values in min and max and click on ‘Find’. This will highlight the areas to sample from. This works analogous for area.
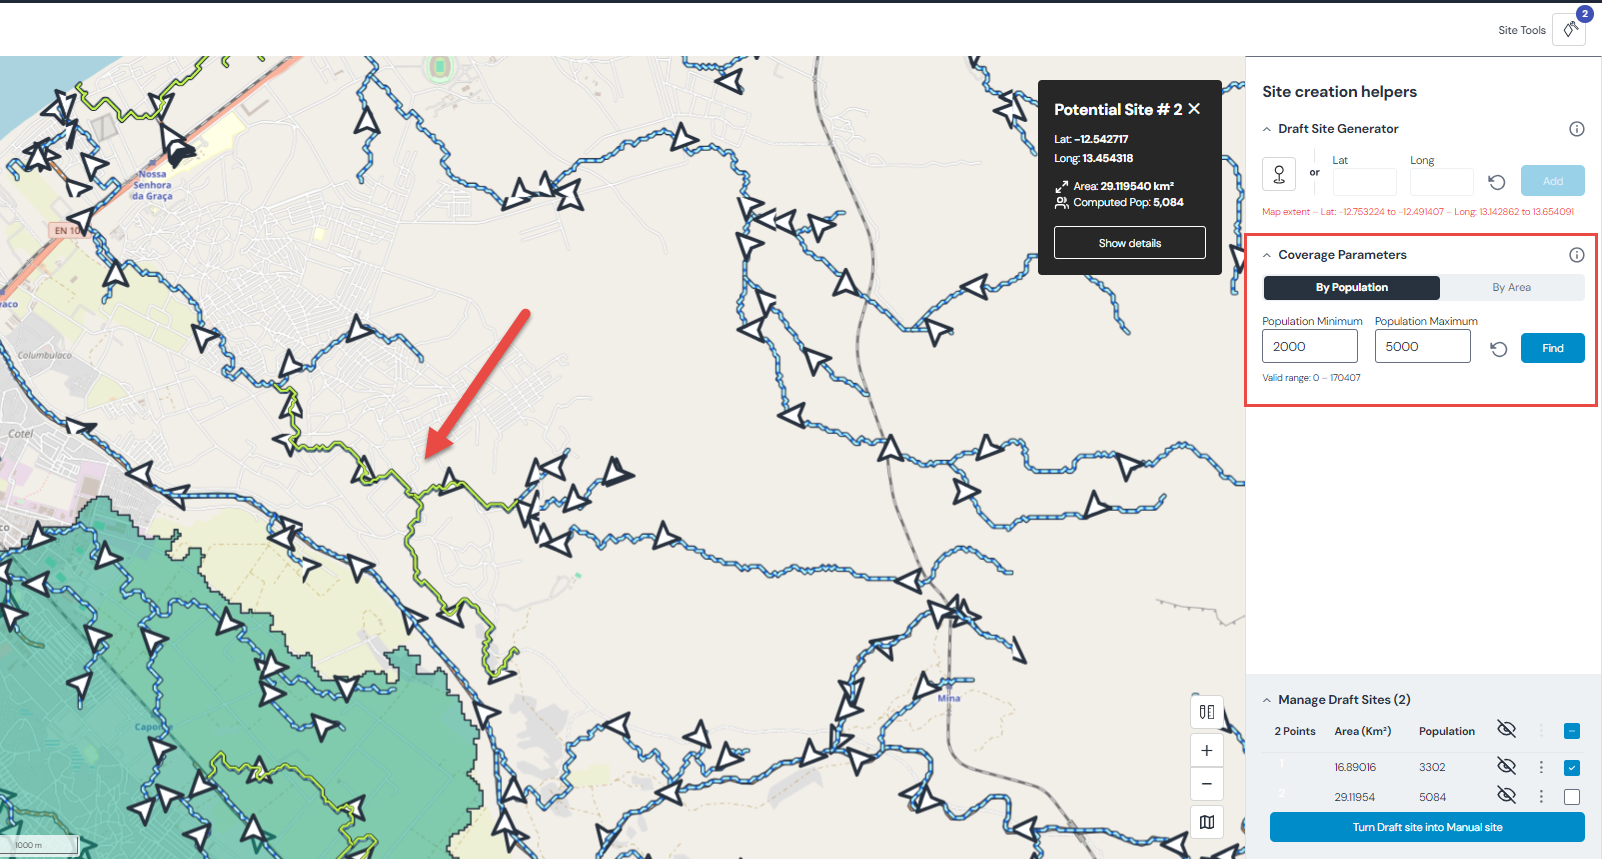
Important
Note, this works currently only for open sewage delineation.
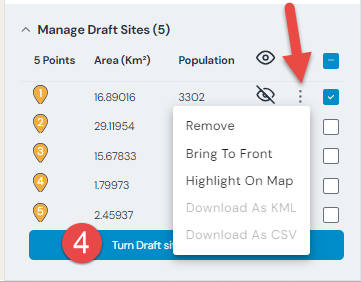
Manage draft sites
All draft sites created will be added to this menu. From here you can:
Remove a draft site
Bring a watershed to the front (if hidden by an overlapping watershed for instance)
Highlight it on the map
Turn one or multiple draft sites into sites via the map editor (note, all site metadata can be added in the map editor later)
Export the draft site as a GeoJSON or CSV
Hydrology layers
The ‘Drainage Lines’ show the predicted flow of the water.
If a site has been created, the ‘Site catchments’ shows the areas that contribute to a site.
Drainage basins are the individual areas that are used to calculate site catchments.
See Premise for explanations of the drainage lines, catchment and drainage basins calculations. See also Map processing parameters to understand the parameters for map processing.
Map edition
Map edition allows to add more details to a map. Sewage lines, exclusion zones, rivers, etc can be added via map edition.
Important
It is recommended to add as much detail as possible to a map to make it as accurate as possible. The first thing to improve a map will be to add OSM data. This data is automatically fetched for the sources where OSM data is available (such as rivers and lakes).
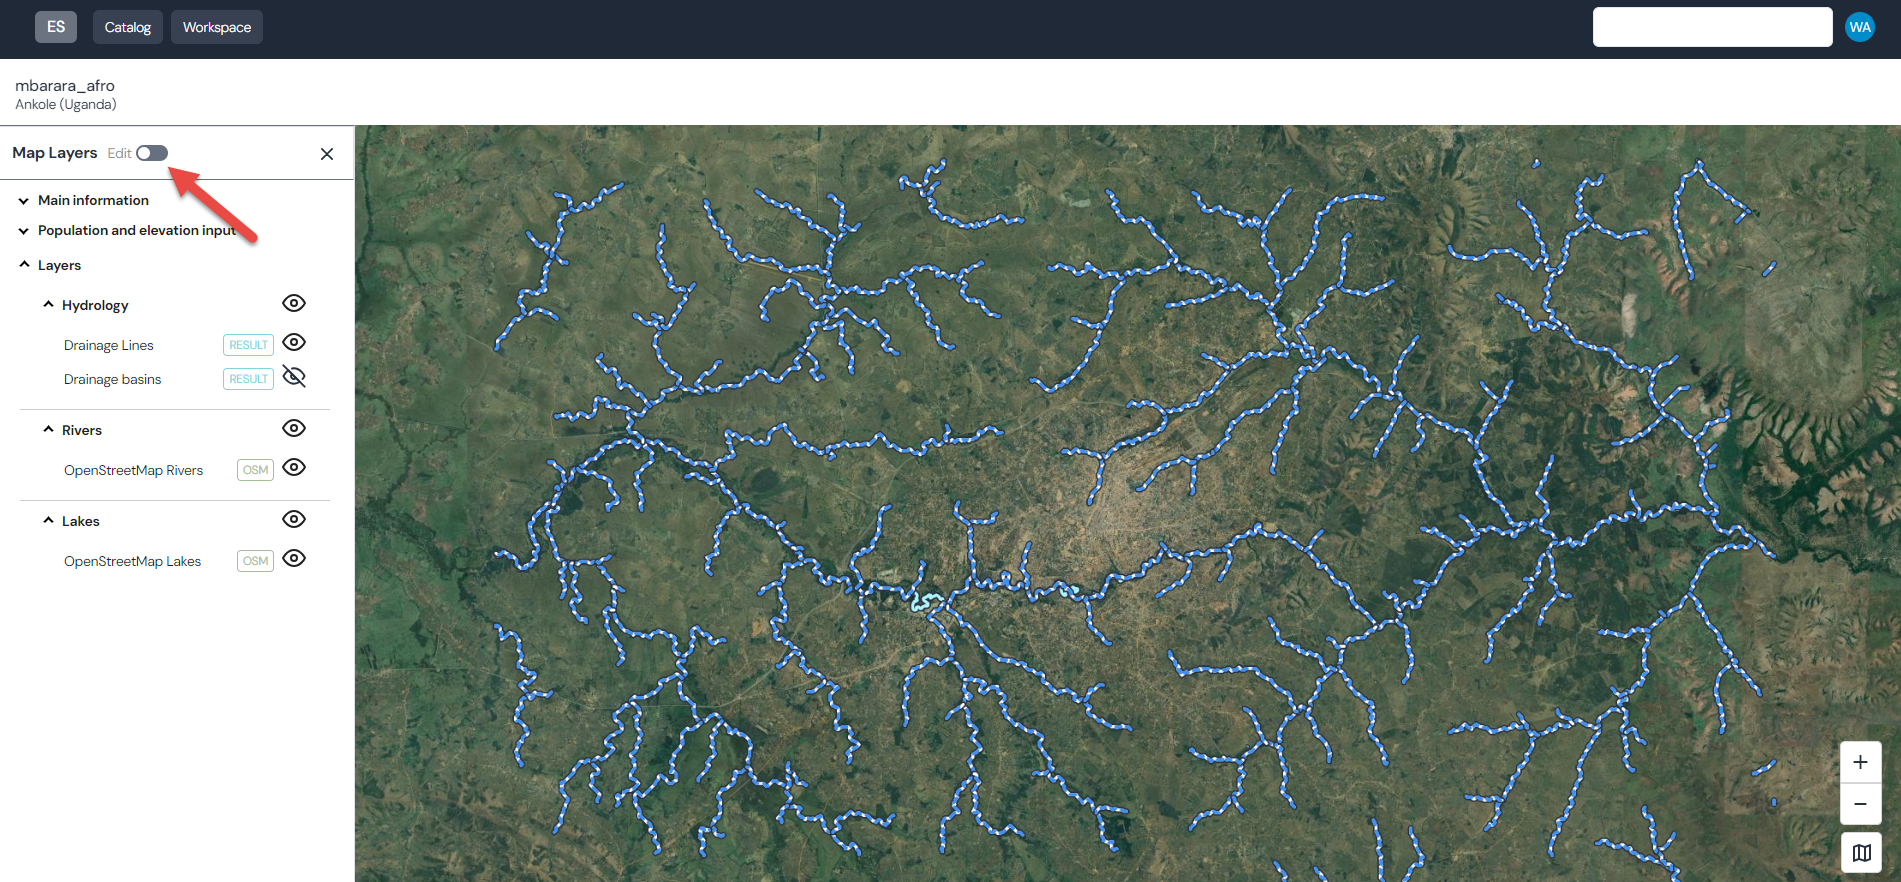
Start map editing
There are two ways to start editing a map:
Via the workspace:
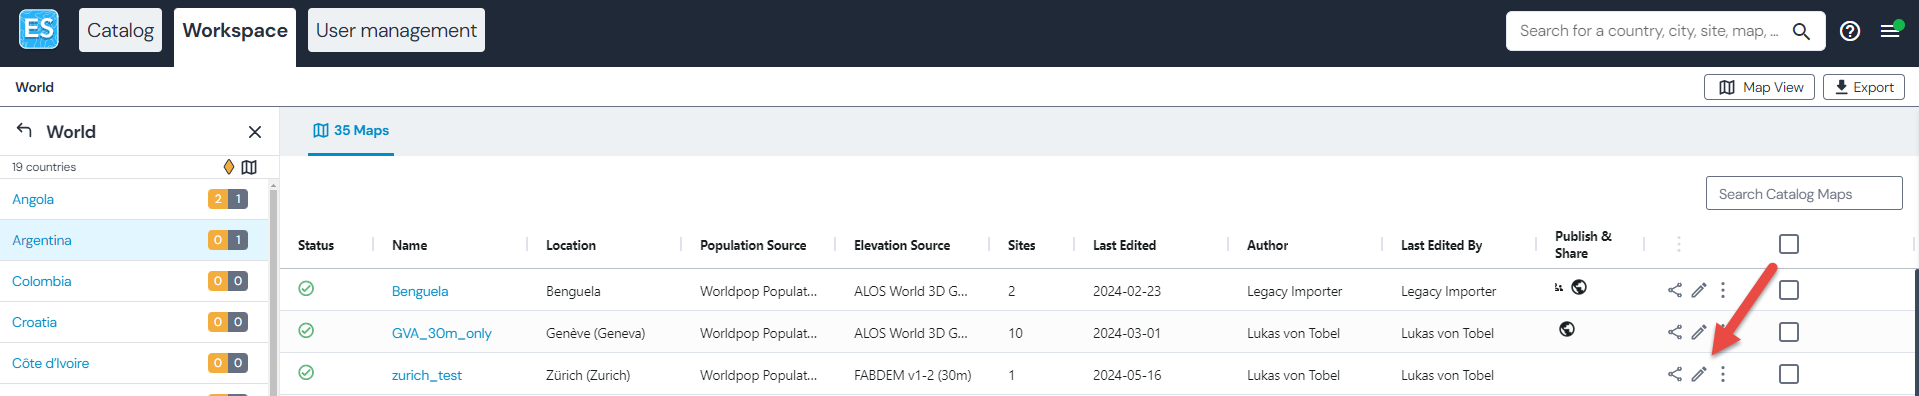
When already on the map:
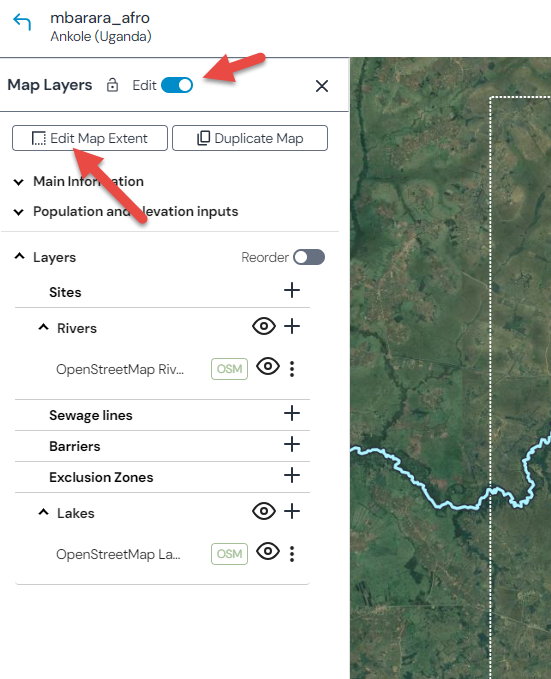
Change the map extent
Important
Works only in edit mode
The extent of a map can be changed within limits:
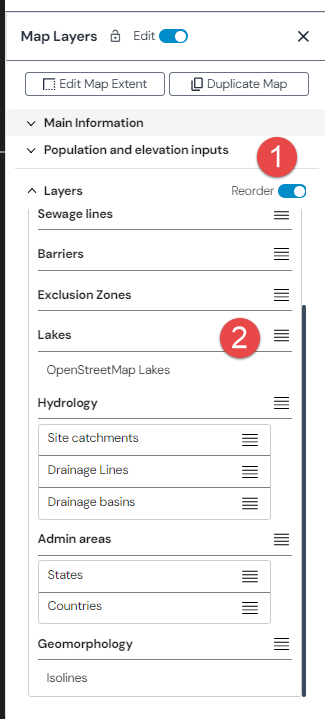
Reordering layers
It is possible to reorder how the layers appear (ie which layer should be on top of another layer etc). To reorder the layers, click the corresponding toggle button and drag the layers into the order you would like.
Important
Reordering requires map processing afterwards to be effective. Additionally, the hydrology layers can be adjusted here, even though these layers are only visible in the map viewer (see Map viewer)!
Add or remove a source to a map
Important
Works only in edit mode
Using the ‘+’ icon, a new source can be added to the map.
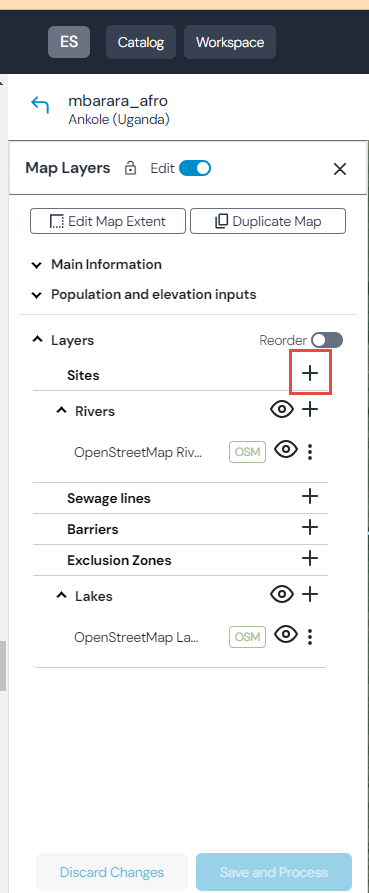
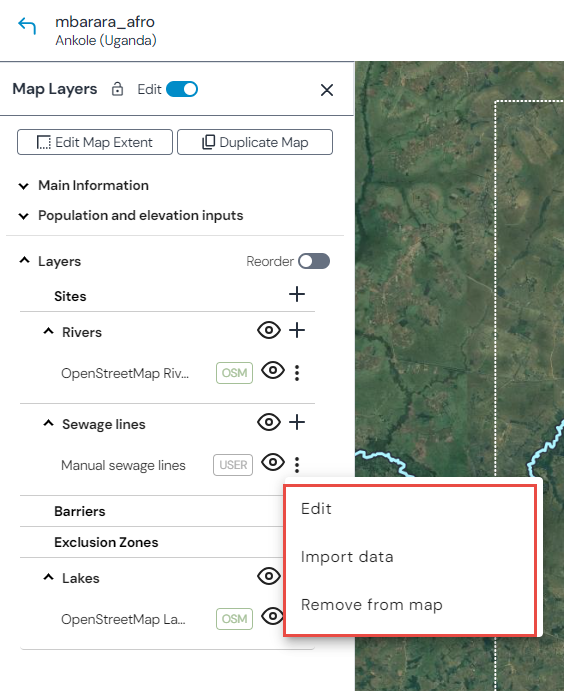
Once a source has been added, it can be edited or removed. Some sources allow import of data.
Important
Import of data is always a drop and replace, meaning that when you load a shp file into a layer, all existing data of this layer will be replaced by the data you import!
Sites
Important
Works only in edit mode
Sites are point features.
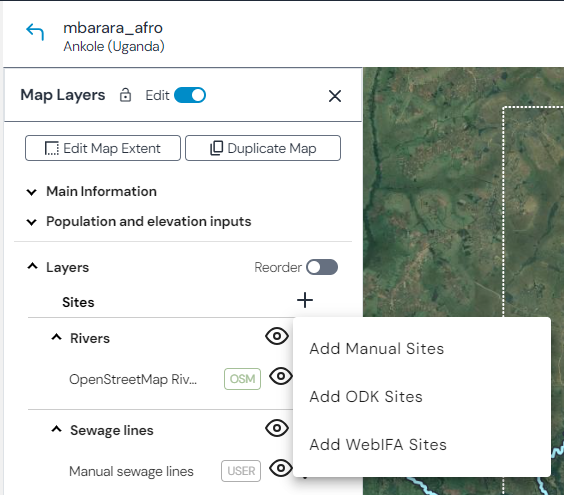
Adding manual sites source
Adding ODK sites source - the ODK import will need a separate setup
Adding WebIFA site source as read only
Adding a manual site source allows to:
Add sites manually (see Editing)
Upload an existing layer in either shp file or geojson format
Hint
When uploading a file, please make sure you respect the data model.
Rivers
Important
Works only in edit mode
Rivers are line features.
Adding manual river source
Adding OSM river source
OSM data can be refreshed, in case new data is available on OSM
Sewage lines
Important
Works only in edit mode
Sewage lines are line features.
Important
Sewage lines can have two main attributes that are important for map processing: Type (open or closed) and Trunk (true or false). For further explanation see Sewage line metadata
Adding manual sewage line source
Adding ONA sweage line source - the ONA import is currently setup to pulling ONA data from AFRO.
Adding ODK sewage line source - the ODK import is currently setup to pull data from a Novel-T ODK server.
Adding OSM underground sewage channels
Adding a manual sewage line source allows to:
Adding sewage lines manually (see Editing)
Upload an existing layer in either shp file or geojson format
Hint
When uploading a file, please make sure you respect the data model.
Barriers
Important
Works only in edit mode
Barriers are line features.
Adding a manual barrier source allows to:
Adding barriers manually (see Editing)
Exclusion zones
Important
Works only in edit mode
Exclusion zones are polygon features.
Adding a manual exclusion source allows to:
Adding exclusion zones manually (see Editing)
Upload an existing layer in either shp file or geojson format
Lakes
Important
Works only in edit mode
Lakes are polygon features.
Adding manual lake source
Adding OSM lake source
OSM data can be refreshed, in case new data is available on OSM
Adding a manual lake source allows to:
Adding lakes manually (see Editing)
Upload an existing layer in either shp file or geojson format
Editing
All layers can be edited. Some editing features are universal:
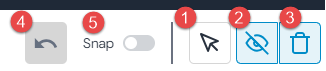
Selection tool - this is active per default and can be used to select individual features
Consider / ignore for processing - this tool can be used to mark / unmark features for map processing (for instance, if there are some features on map that you think should not be considered for map processing but you still want to keep them, you can use this tool)
Delete - this tool allows to delete features from a layer
When drawing a shape, you can always use the ‘Undo’ button which will undraw the last point drawn
Snapping allows to connect sites, sewage lines, rivers etc properly
The editing dialog depends on the layer (point, line or polygon layer).
Point layer editing
This is used to add sites. Sites / points can be added via this tool (or via import, see Sites):

Adding sites manually triggers a dialog where metadata can be added.
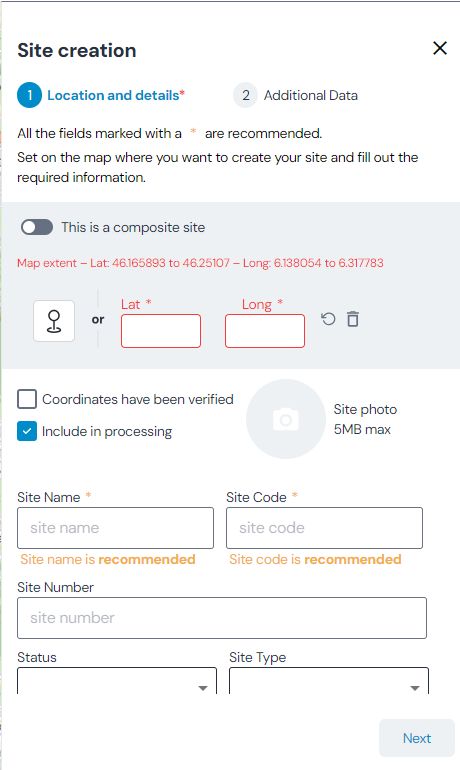
In this dialog, the only required field are the coordinates.
Note that you can add composite sites via the toggle at the top. There are two types of composite sites:
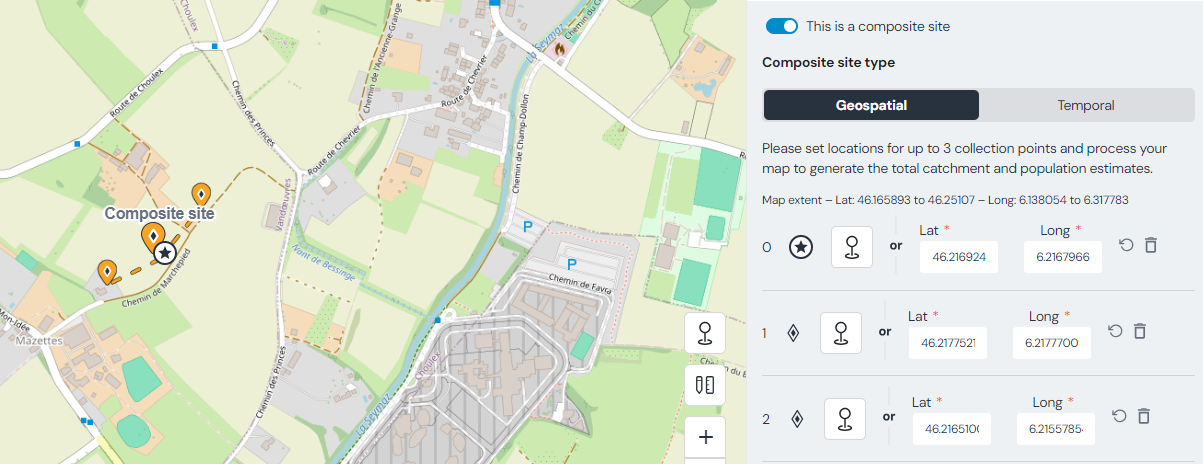
Geospatial composite site (one site name that corresponds to several nearby sampling locations)
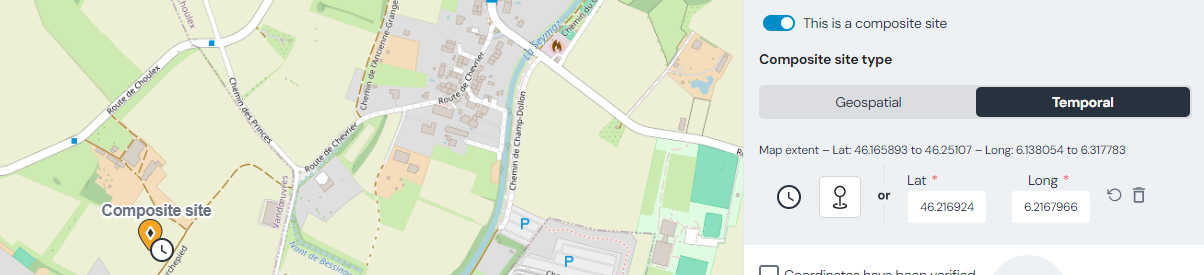
Temporal composite site (sampling the same location over the course of several minutes or hours)
For the geospatial composite sites, up to three geospatial coordinate pairs can be entered. The main site is depicted with a star icon, the sub-sites are slightly smaller and without a star.
The temporal composite site is depicted with a clock on the site icon.
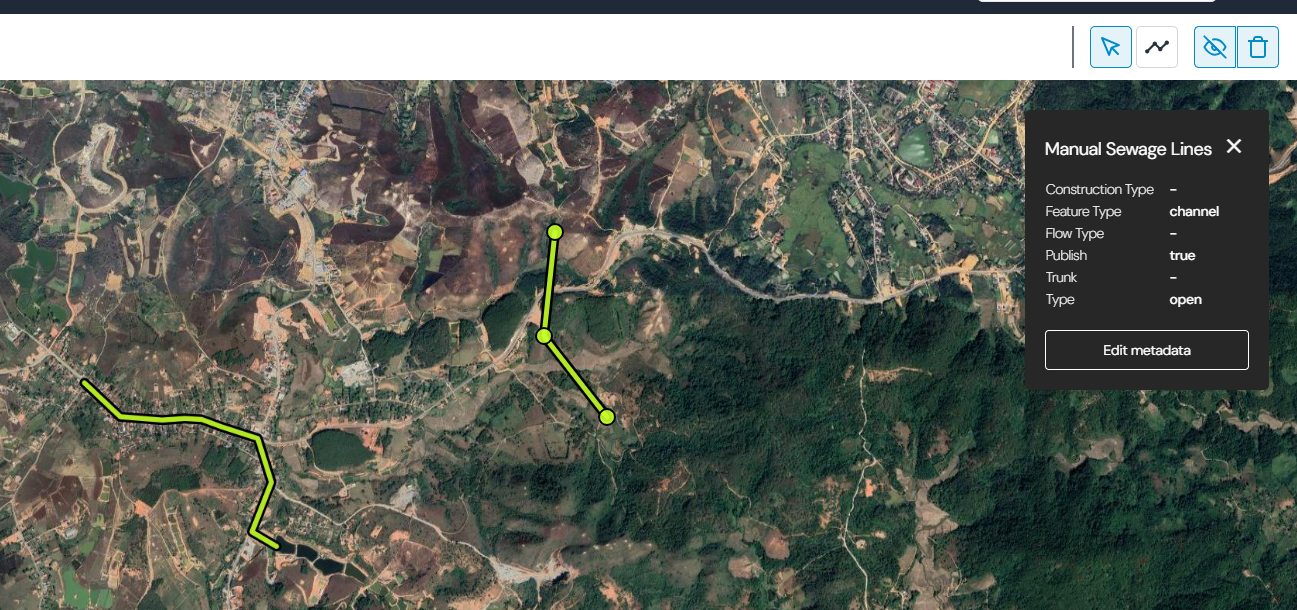
Line layer editing
You can draw lines via this tool:
Click on the tool to draw. Double click to finalize the shape. Once you finalized the shape, you can still edit it (drag the vertices to the right place). You can always edit a feature as long as the vertices show. If you select multiple features at the same time, you can batch delete or batch consider / ignore them for processing.
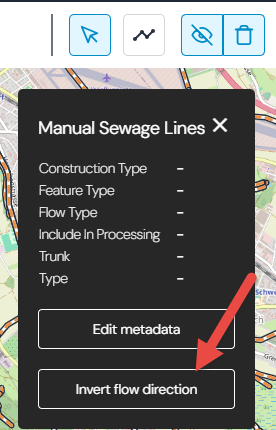
Hint
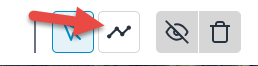
You can use the ‘Invert flow direction’ tool to change the direction of drawn lines.
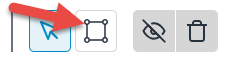
Polygon layer editing
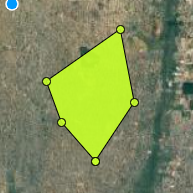
You can draw polygons via this tool:
Click on the tool to draw. Double click to finalize the shape. Once you finalized the shape, you can still edit it (drag the vertices to the right place). You can always edit a feature as long as the vertices show. If you select multiple features at the same time, you can batch delete or batch consider / ignore them for processing.
Metadata editing
Hint
Features that are added to the map can be clicked on to see corresponding metadata.
For instance:
Click on the added WebIFA site
The dialog will open with the metadata for this feature
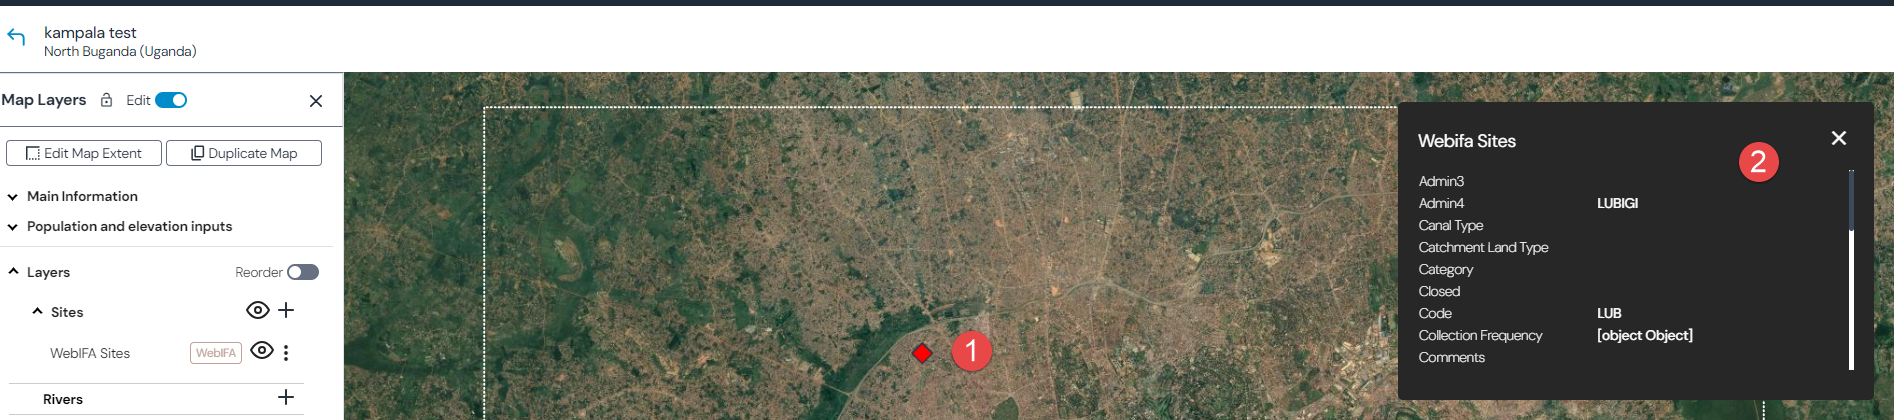
Some of the metadata can be edited.
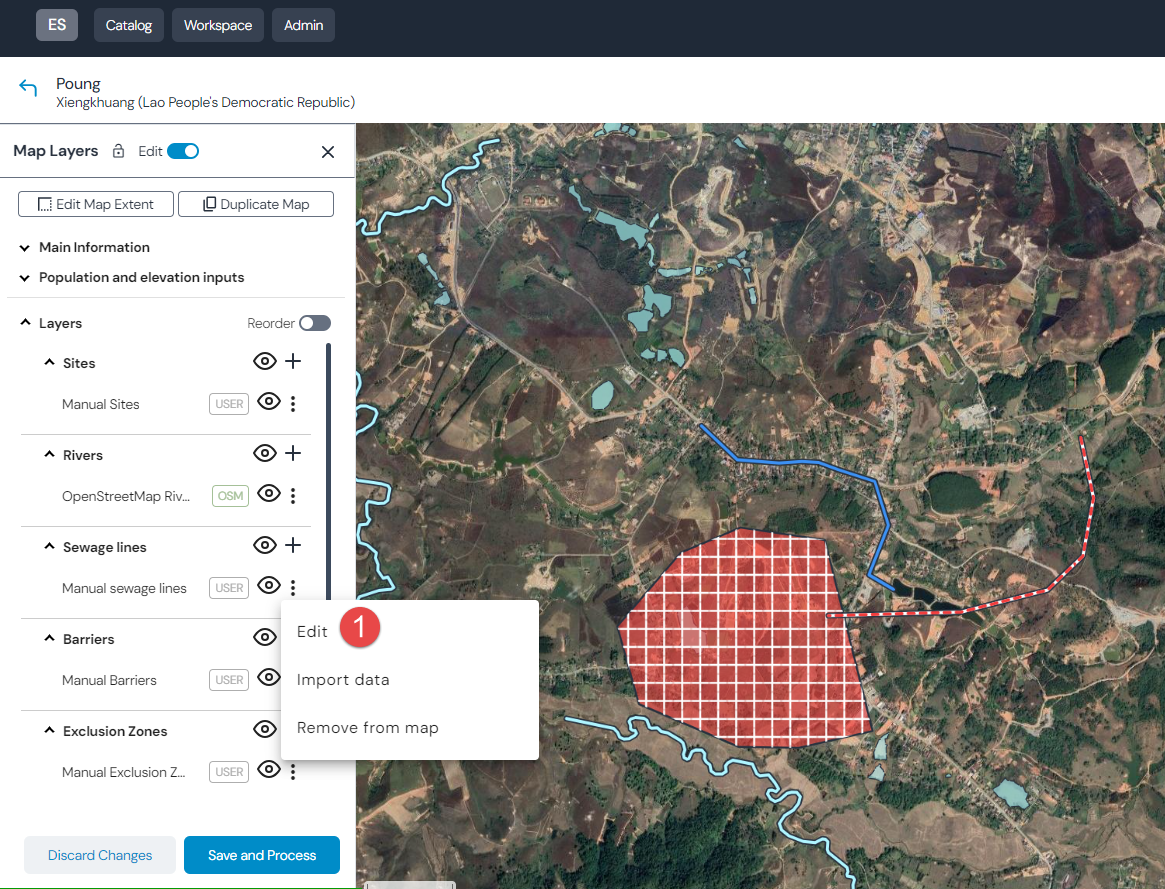
Important
Works only in edit mode
Click ‘Edit’ of the layer you want to edit the metadata for
Click on the feature you want to edit
Click on ‘Edit metadata’
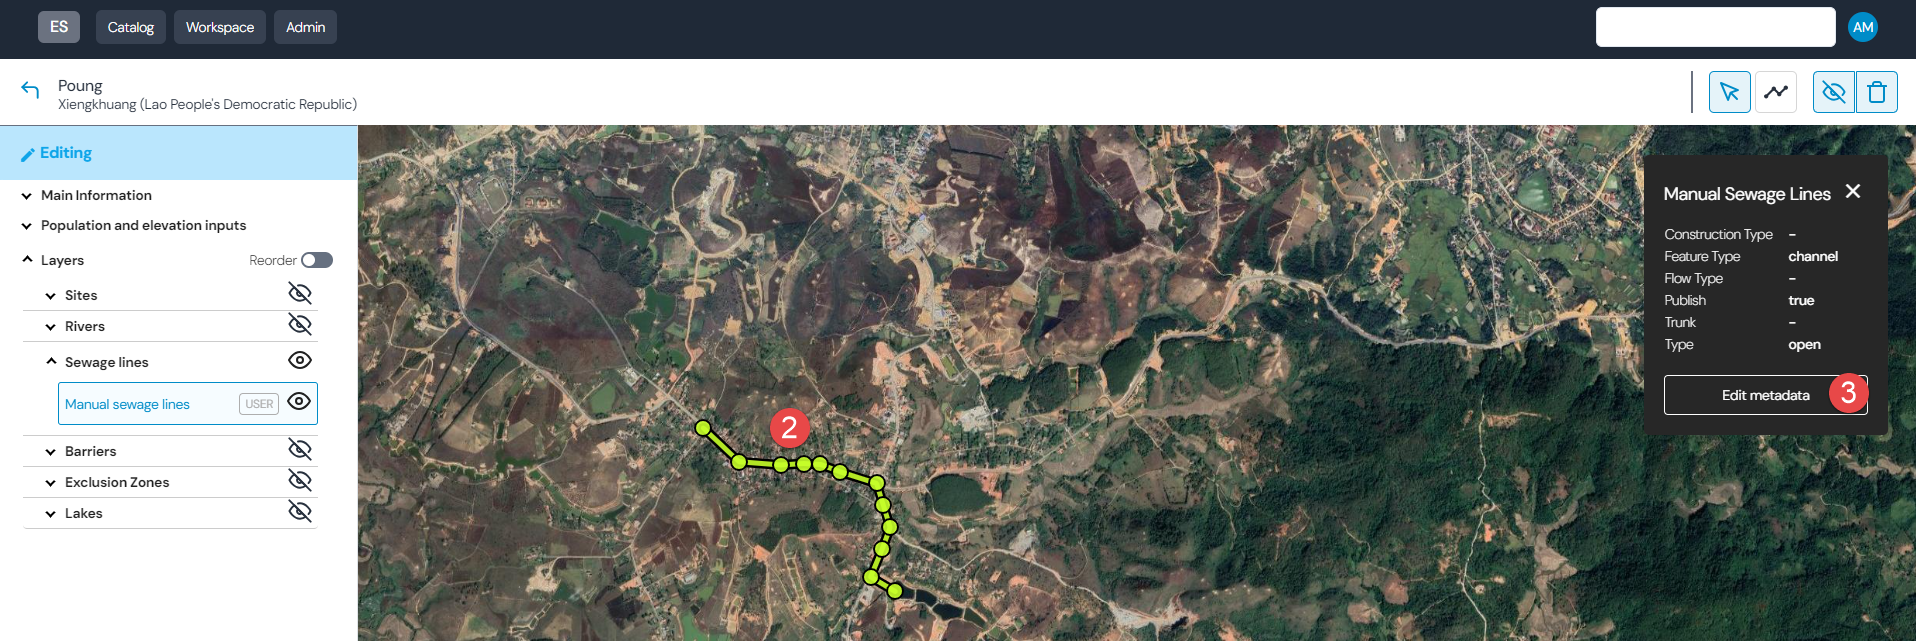
Important
The metadata for sewage lines is important for map processing. See Map processing parameters to better understand how.
Remote source editing
Remote data sources such as OSM or ODK cannot be modified at their source, since this data is remotely sourced and there is no push from ES to those remote sources. However, the data can still be modified in ES, though those modifications will then be stored in a manual layer.
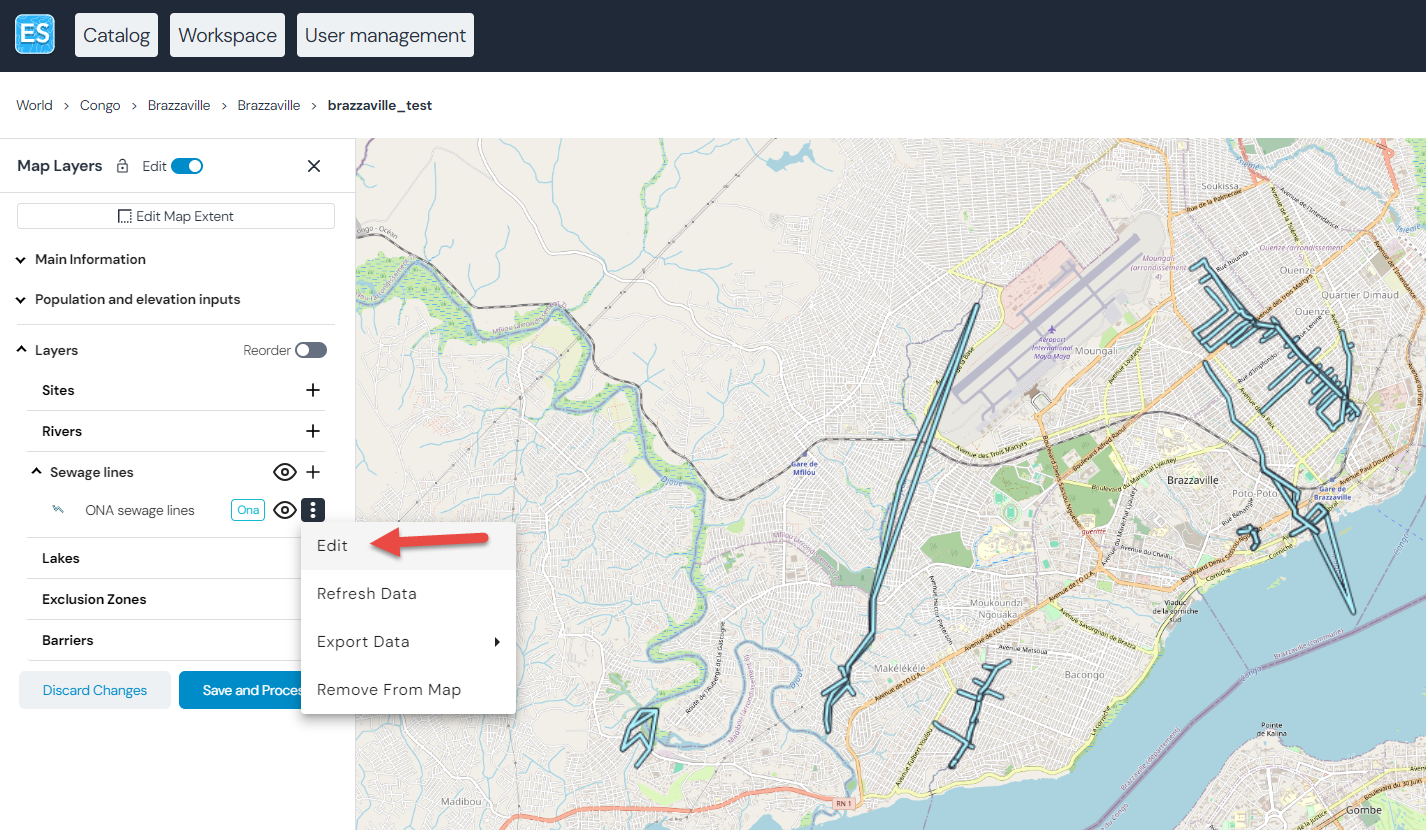
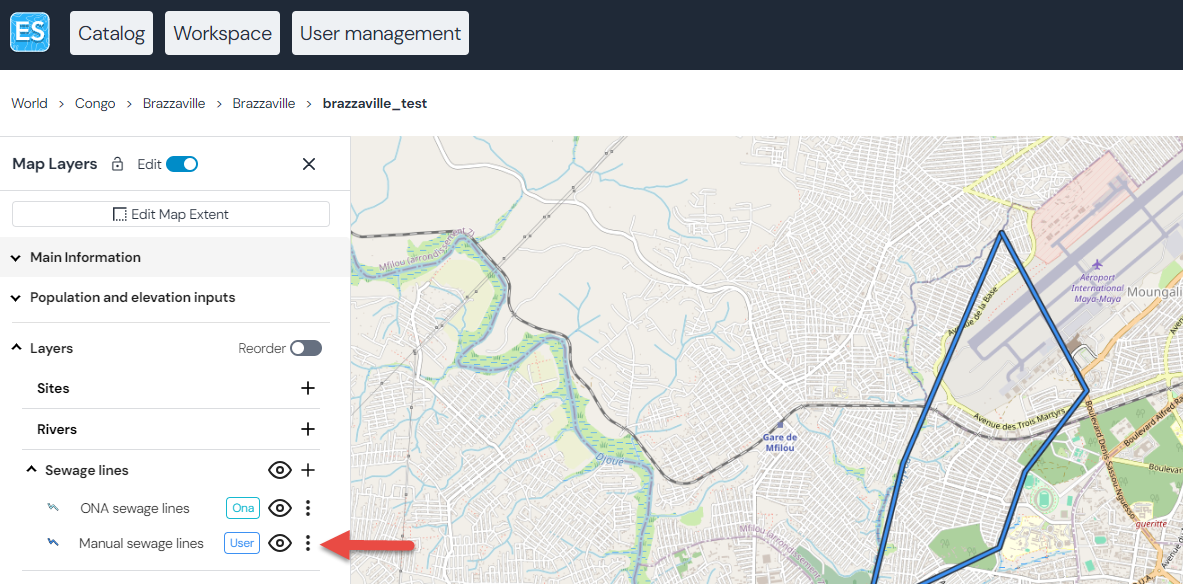
To modify ONA (or other remote) collected data:
Go into the edit mode of the ONA sewage lines
Start editing the lines as you would in another layer
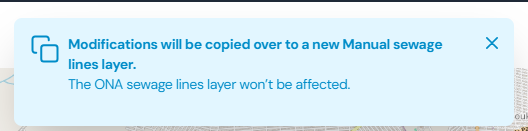
Note the dialog that notifies that the modifications will be copied
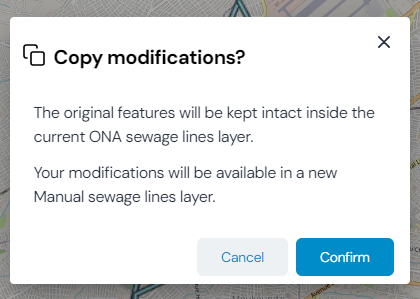
Once you are done editing the layer, clicking ‘Save’ will show you the confirmation popup
After confirmation, the modified lines are now hidden in the ONA layer but present in the manual sewage layer
Important
If you refresh any remote source before saving this layer first, all features in their original state are back, even the ones that were hidden previously. They will have to be manually hidden again after a refreshment. This is not the case if the layer has already been processed once, in which case the layer remembers the previous state.